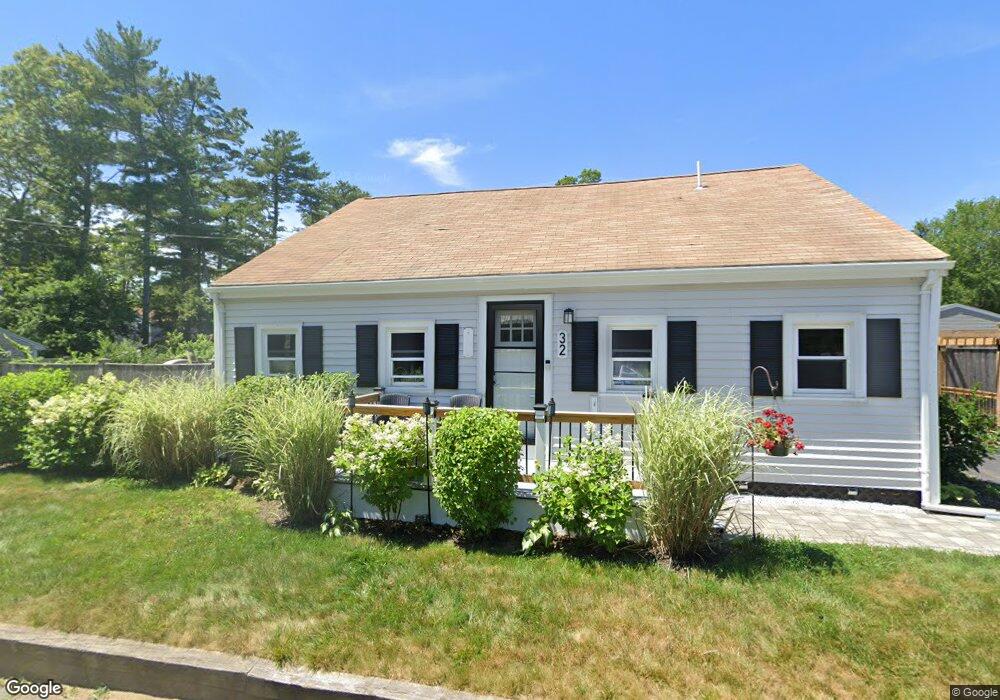
32 Union Park St Hanson, MA 02341
Estimated Value: $451,715 - $483,000
3
Beds
2
Baths
1,224
Sq Ft
$380/Sq Ft
Est. Value
About This Home
This home is located at 32 Union Park St, Hanson, MA 02341 and is currently estimated at $465,429, approximately $380 per square foot. 32 Union Park St is a home located in Plymouth County.
Ownership History
Date
Name
Owned For
Owner Type
Purchase Details
Closed on
Dec 5, 2003
Sold by
Davies Christopher W and Davies Tanya L
Bought by
Richard Wayne L
Current Estimated Value
Home Financials for this Owner
Home Financials are based on the most recent Mortgage that was taken out on this home.
Original Mortgage
$240,000
Interest Rate
6.03%
Mortgage Type
Purchase Money Mortgage
Purchase Details
Closed on
Jun 19, 1998
Sold by
Household Finance Corp
Bought by
Davies Christopher W and Davies Tanya L
Purchase Details
Closed on
Sep 15, 1988
Sold by
Lambert Scott A
Bought by
Jaeger Steven R
Create a Home Valuation Report for This Property
The Home Valuation Report is an in-depth analysis detailing your home's value as well as a comparison with similar homes in the area
Home Values in the Area
Average Home Value in this Area
Purchase History
| Date | Buyer | Sale Price | Title Company |
|---|---|---|---|
| Richard Wayne L | $240,000 | -- | |
| Davies Christopher W | $101,000 | -- | |
| Jaeger Steven R | $106,500 | -- |
Source: Public Records
Mortgage History
| Date | Status | Borrower | Loan Amount |
|---|---|---|---|
| Open | Jaeger Steven R | $250,000 | |
| Closed | Jaeger Steven R | $240,000 | |
| Previous Owner | Jaeger Steven R | $50,000 |
Source: Public Records
Tax History Compared to Growth
Tax History
| Year | Tax Paid | Tax Assessment Tax Assessment Total Assessment is a certain percentage of the fair market value that is determined by local assessors to be the total taxable value of land and additions on the property. | Land | Improvement |
|---|---|---|---|---|
| 2025 | $5,015 | $374,800 | $142,100 | $232,700 |
| 2024 | $4,870 | $364,000 | $138,000 | $226,000 |
| 2023 | $4,749 | $334,900 | $138,000 | $196,900 |
| 2022 | $4,593 | $304,400 | $125,400 | $179,000 |
| 2021 | $3,935 | $260,600 | $120,600 | $140,000 |
| 2020 | $3,876 | $253,800 | $116,500 | $137,300 |
| 2019 | $3,606 | $232,200 | $107,100 | $125,100 |
| 2018 | $3,563 | $225,100 | $103,000 | $122,100 |
| 2017 | $3,349 | $209,600 | $91,600 | $118,000 |
| 2016 | $3,384 | $204,500 | $91,600 | $112,900 |
| 2015 | $3,213 | $201,800 | $91,600 | $110,200 |
Source: Public Records
Map
Nearby Homes