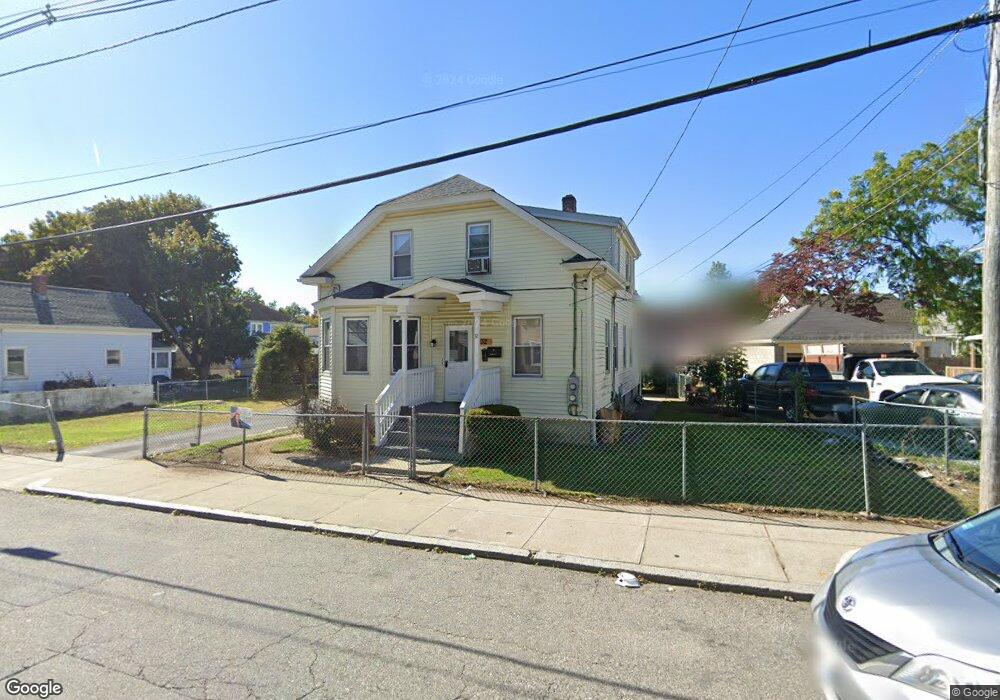
32 Unit St Providence, RI 02909
Manton NeighborhoodEstimated Value: $370,573 - $497,000
4
Beds
2
Baths
1,929
Sq Ft
$231/Sq Ft
Est. Value
About This Home
This home is located at 32 Unit St, Providence, RI 02909 and is currently estimated at $444,643, approximately $230 per square foot. 32 Unit St is a home located in Providence County with nearby schools including Charles N. Fortes Elementary School, Asa Messer Elementary School, and Laurel Hill Annex School.
Ownership History
Date
Name
Owned For
Owner Type
Purchase Details
Closed on
May 7, 2021
Sold by
Murillo Ernesto and Murillo Irene
Bought by
E Sr & Irene Murillo Irt
Current Estimated Value
Purchase Details
Closed on
Nov 5, 1986
Bought by
Murillo Ernesto and Murillo Irene
Create a Home Valuation Report for This Property
The Home Valuation Report is an in-depth analysis detailing your home's value as well as a comparison with similar homes in the area
Home Values in the Area
Average Home Value in this Area
Purchase History
| Date | Buyer | Sale Price | Title Company |
|---|---|---|---|
| E Sr & Irene Murillo Irt | -- | None Available | |
| Murillo Ernesto | $59,000 | -- |
Source: Public Records
Mortgage History
| Date | Status | Borrower | Loan Amount |
|---|---|---|---|
| Previous Owner | Murillo Ernesto | $88,000 | |
| Previous Owner | Murillo Ernesto | $30,000 | |
| Previous Owner | Murillo Ernesto | $12,000 | |
| Previous Owner | Murillo Ernesto | $95,000 |
Source: Public Records
Tax History Compared to Growth
Tax History
| Year | Tax Paid | Tax Assessment Tax Assessment Total Assessment is a certain percentage of the fair market value that is determined by local assessors to be the total taxable value of land and additions on the property. | Land | Improvement |
|---|---|---|---|---|
| 2025 | $2,895 | $344,600 | $127,300 | $217,300 |
| 2024 | $4,692 | $255,700 | $73,600 | $182,100 |
| 2023 | $4,692 | $255,700 | $73,600 | $182,100 |
| 2022 | $4,551 | $255,700 | $73,600 | $182,100 |
| 2021 | $4,310 | $175,500 | $51,500 | $124,000 |
| 2020 | $4,310 | $175,500 | $51,500 | $124,000 |
| 2019 | $4,310 | $175,500 | $51,500 | $124,000 |
| 2018 | $3,103 | $97,100 | $33,100 | $64,000 |
| 2017 | $3,103 | $97,100 | $33,100 | $64,000 |
| 2016 | $3,784 | $118,400 | $33,100 | $85,300 |
| 2015 | $3,489 | $105,400 | $30,300 | $75,100 |
| 2014 | $3,557 | $105,400 | $30,300 | $75,100 |
| 2013 | $3,557 | $105,400 | $30,300 | $75,100 |
Source: Public Records
Map
Nearby Homes