Estimated Value: $279,000 - $283,137
--
Bed
--
Bath
1,683
Sq Ft
$167/Sq Ft
Est. Value
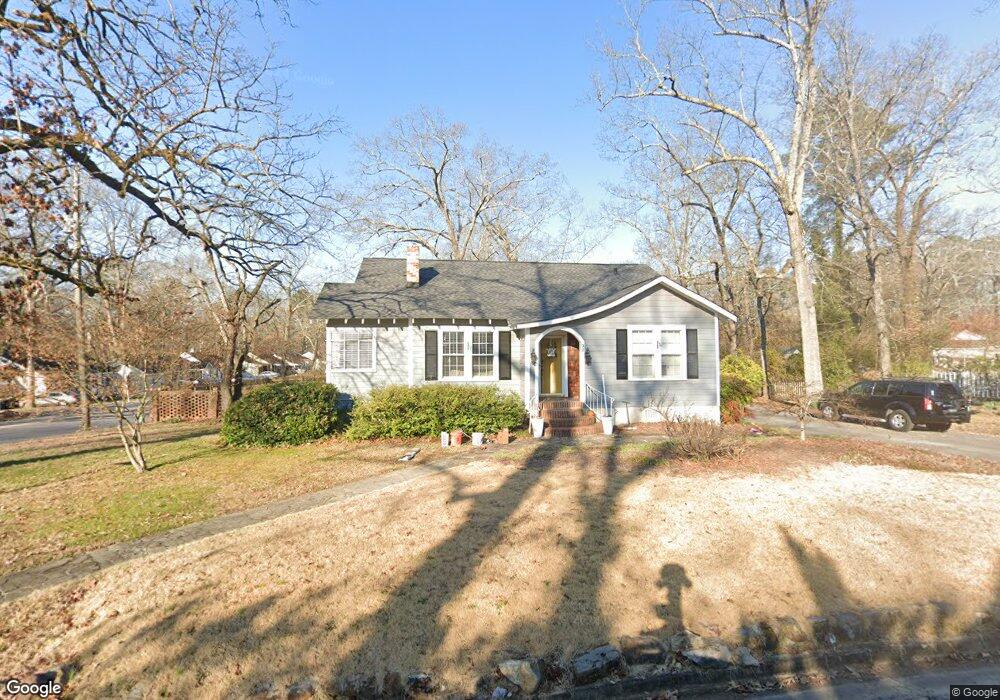
About This Home
This home is located at 32 Vineland Dr NW, Rome, GA 30165 and is currently estimated at $280,784, approximately $166 per square foot. 32 Vineland Dr NW is a home located in Floyd County with nearby schools including Rome High School.
Ownership History
Date
Name
Owned For
Owner Type
Purchase Details
Closed on
Nov 8, 2021
Sold by
Abney Christopher T
Bought by
Lillie David and Lillie Anna
Current Estimated Value
Purchase Details
Closed on
Mar 30, 2011
Sold by
Abney Dennis C
Bought by
Abney Christopher T
Home Financials for this Owner
Home Financials are based on the most recent Mortgage that was taken out on this home.
Original Mortgage
$78,000
Interest Rate
4.83%
Mortgage Type
Unknown
Purchase Details
Closed on
Dec 20, 1996
Sold by
Reiners John R and Reiners Peggy A
Bought by
Abney Dennis C and Abney Nancy S
Purchase Details
Closed on
Jun 28, 1984
Sold by
Morrow Robert G and Roberson Penny A
Bought by
Reiners John R and Reiners Peggy A
Purchase Details
Closed on
May 31, 1983
Sold by
Penney Riddle G and Penney Roberson
Bought by
Morrow Robert G and Roberson Penny A
Purchase Details
Closed on
Mar 8, 1982
Bought by
P and R
Purchase Details
Closed on
Dec 28, 1979
Sold by
West Glenda Hall and Trisha Ann Hall Stewa
Bought by
Penney Riddle G and Penney Roberson
Purchase Details
Closed on
Dec 4, 1978
Sold by
Hall W C
Bought by
West Glenda Hall and Trisha Ann Hall
Purchase Details
Closed on
Jan 1, 1901
Bought by
Hall W C
Create a Home Valuation Report for This Property
The Home Valuation Report is an in-depth analysis detailing your home's value as well as a comparison with similar homes in the area
Home Values in the Area
Average Home Value in this Area
Purchase History
| Date | Buyer | Sale Price | Title Company |
|---|---|---|---|
| Lillie David | $240,000 | -- | |
| Abney Christopher T | $57,000 | -- | |
| Abney Christopher T | $57,000 | -- | |
| Abney Dennis C | $70,000 | -- | |
| Reiners John R | -- | -- | |
| Morrow Robert G | -- | -- | |
| P | -- | -- | |
| Penney Riddle G | $32,700 | -- | |
| West Glenda Hall | -- | -- | |
| Hall W C | -- | -- |
Source: Public Records
Mortgage History
| Date | Status | Borrower | Loan Amount |
|---|---|---|---|
| Previous Owner | Abney Christopher T | $78,000 |
Source: Public Records
Tax History Compared to Growth
Tax History
| Year | Tax Paid | Tax Assessment Tax Assessment Total Assessment is a certain percentage of the fair market value that is determined by local assessors to be the total taxable value of land and additions on the property. | Land | Improvement |
|---|---|---|---|---|
| 2024 | $2,801 | $117,114 | $17,076 | $100,038 |
| 2023 | $3,451 | $97,644 | $15,523 | $82,121 |
| 2022 | $2,954 | $82,231 | $12,807 | $69,424 |
| 2021 | $2,126 | $57,307 | $12,807 | $44,500 |
| 2020 | $1,937 | $51,777 | $9,702 | $42,075 |
| 2019 | $1,736 | $46,886 | $9,702 | $37,184 |
| 2018 | $1,651 | $44,613 | $9,702 | $34,911 |
| 2017 | $1,601 | $43,255 | $9,702 | $33,553 |
| 2016 | $1,571 | $42,312 | $9,680 | $32,632 |
| 2015 | $1,450 | $42,312 | $9,680 | $32,632 |
| 2014 | $1,450 | $41,352 | $9,680 | $31,672 |
Source: Public Records
Map
Nearby Homes
- 614 Briarwood Cir NW
- 808 Charlton St NW
- 204 Oakwood St NW
- 7 Raymond Ave NW
- 208 Dodd St NW
- 105 Robin St NW
- 0 Unbridled Rd Unit 22 23074684
- 124 Sheridan Dr NW
- 4 Colonial Dr NW
- 23 Sweetspire Dr NW
- 21 Sweetspire Dr NW
- 15 Silverbell Ln
- 209 Sherwood Rd SW
- 9 Shorter Cir SW
- 8 S Hughes St SW
- 214 N Elm St NW
- 3 Berckman Ln SW
- 19 Berckman Ln SW
- 32 Vineland Dr NW
- 514 Charlton St NW
- 601 Charlton St NW
- 523 Charlton St NW
- 28 Vineland Dr NW
- 26 Vineland Dr NW
- 600 Charlton St NW
- 512 Charlton St NW
- 23 Vineland Dr NW
- 603 Charlton St NW
- 521 Charlton St NW
- 24 Vineland Dr NW
- 519 Charlton St NW
- 0 Vineland Dr NW Unit 17 8271559
- 0 Vineland Dr NW Unit 17
- 0 Vineland Dr NW Unit 9052357
- 0 Vineland Dr NW Unit 3135130
- 0 Vineland Dr NW Unit 7084627
- 0 Vineland Dr NW Unit 7122370
- 0 Vineland Dr NW Unit 7625773