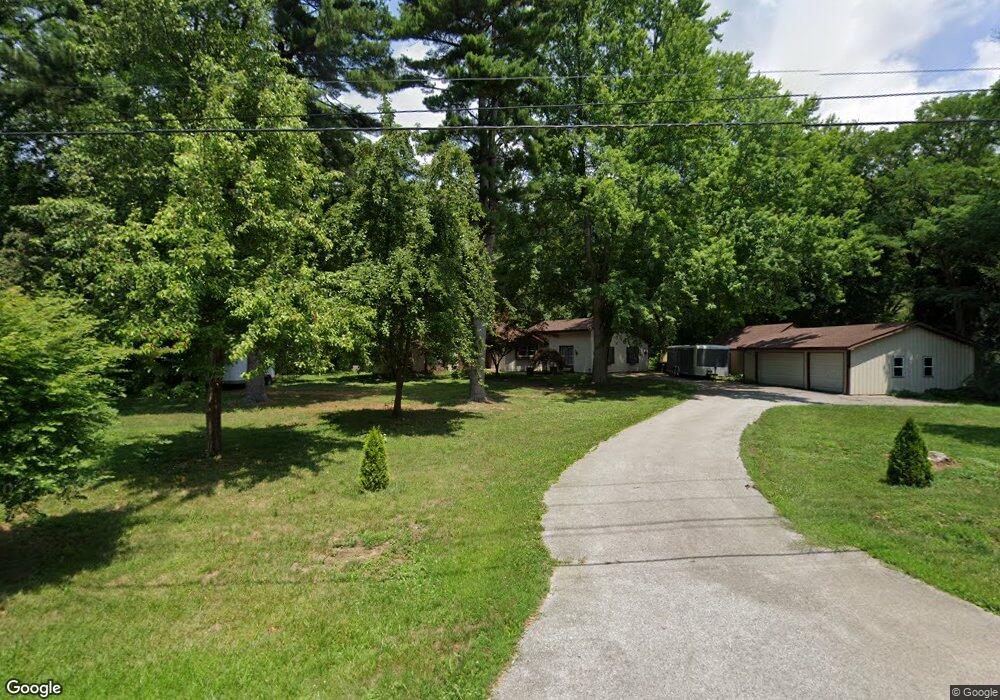
32 W 300 S Lafayette, IN 47909
Old Romney NeighborhoodEstimated Value: $339,000 - $373,000
--
Bed
--
Bath
2,727
Sq Ft
$132/Sq Ft
Est. Value
About This Home
This home is located at 32 W 300 S, Lafayette, IN 47909 and is currently estimated at $358,859, approximately $131 per square foot. 32 W 300 S is a home located in Tippecanoe County with nearby schools including Mayflower Mill Elementary School, Southwestern Middle School, and McCutcheon High School.
Ownership History
Date
Name
Owned For
Owner Type
Purchase Details
Closed on
Dec 29, 2016
Sold by
Sharon S Haby Trust Dated 6/27
Bought by
Douglas Werner Glenn
Current Estimated Value
Purchase Details
Closed on
Oct 18, 2007
Sold by
Haby Richard and Haby Sharon
Bought by
Sharon S Haby Declaration Of Trust
Home Financials for this Owner
Home Financials are based on the most recent Mortgage that was taken out on this home.
Original Mortgage
$136,000
Interest Rate
6.38%
Mortgage Type
New Conventional
Purchase Details
Closed on
Apr 6, 2007
Sold by
Haby Richard and Haby Sharon S
Bought by
Sharon S Haby Declaration Of Trust
Purchase Details
Closed on
Feb 28, 2005
Sold by
Faulkner Joseph A and Faulkner Beth A
Bought by
Haby Richard and Haby Sharon S
Create a Home Valuation Report for This Property
The Home Valuation Report is an in-depth analysis detailing your home's value as well as a comparison with similar homes in the area
Home Values in the Area
Average Home Value in this Area
Purchase History
| Date | Buyer | Sale Price | Title Company |
|---|---|---|---|
| Douglas Werner Glenn | $170,000 | -- | |
| Werner Glenn Douglas | $170,000 | Stallard And Schuh | |
| Sharon S Haby Declaration Of Trust | -- | None Available | |
| Haby Richard | -- | None Available | |
| Sharon S Haby Declaration Of Trust | -- | None Available | |
| Haby Richard | -- | -- |
Source: Public Records
Mortgage History
| Date | Status | Borrower | Loan Amount |
|---|---|---|---|
| Previous Owner | Haby Richard | $136,000 |
Source: Public Records
Tax History Compared to Growth
Tax History
| Year | Tax Paid | Tax Assessment Tax Assessment Total Assessment is a certain percentage of the fair market value that is determined by local assessors to be the total taxable value of land and additions on the property. | Land | Improvement |
|---|---|---|---|---|
| 2024 | $3,236 | $313,100 | $40,600 | $272,500 |
| 2023 | $3,125 | $295,400 | $40,600 | $254,800 |
| 2022 | $2,765 | $260,900 | $27,700 | $233,200 |
| 2021 | $2,540 | $237,900 | $27,700 | $210,200 |
| 2020 | $2,363 | $220,400 | $27,700 | $192,700 |
| 2019 | $2,241 | $208,200 | $27,700 | $180,500 |
| 2018 | $2,153 | $200,100 | $27,700 | $172,400 |
| 2017 | $2,187 | $202,900 | $27,700 | $175,200 |
| 2016 | $2,125 | $197,400 | $27,700 | $169,700 |
| 2014 | $1,865 | $174,100 | $27,700 | $146,400 |
| 2013 | $1,739 | $162,400 | $27,700 | $134,700 |
Source: Public Records
Map
Nearby Homes
- 324 Persimmon Trail
- 3428 Ingram Ct
- 312 Hibiscus Dr
- 3267 Hendrickson Ln
- 20 Carolyn Ct
- 3638 Round Rock Ct
- 116 Wise Dr
- 617 Stockbridge Ln
- 3416 Coventry Ln
- 126 Kensal Ct
- 304 Jersey Ln
- 318 Thames Ave
- 2820 Limestone Ln
- 12 Brookhill Ct
- 2830 Duroc Dr Unit A
- 1100 W 275 S
- 51 Brookberry Dr
- 4108 Westwind Dr
- 936 Brookridge Ct
- 904 N Southland Dr
- 32 W 300 S
- 32 W 300 S
- 32 W 300 S
- 32 W 300 S
- 32 W 300 S
- 32 W 300 S
- 18 W 300 S
- 112 W 300 S
- 3444 Old Us Highway 231 S
- 3501 Indianbrook Dr
- 3430 Old Us Highway 231 S
- 3435 Old Romney Rd
- 109 W 300 S
- 3445 Old Romney Rd
- 3502 Indianbrook Dr
- 3505 Indianbrook Dr
- 3508 Indianbrook Dr
- 3506 Indianbrook Dr
- 3509 Indianbrook Dr
- 203 Cromwell Ct