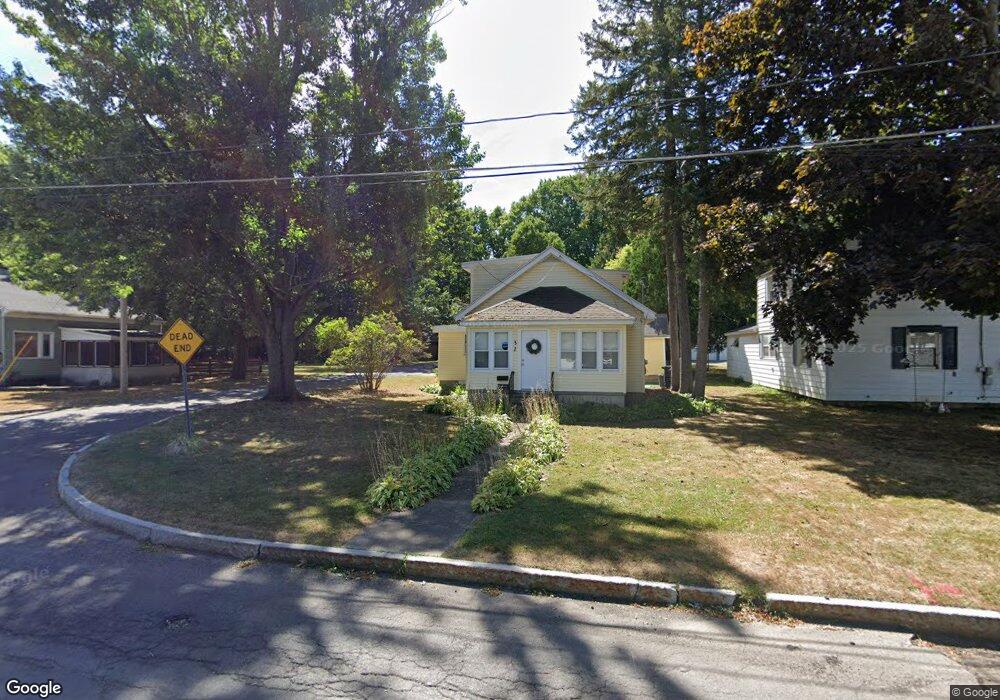
32 W 5th St S Fulton, NY 13069
Estimated Value: $133,000 - $157,000
3
Beds
2
Baths
1,200
Sq Ft
$121/Sq Ft
Est. Value
About This Home
This home is located at 32 W 5th St S, Fulton, NY 13069 and is currently estimated at $145,593, approximately $121 per square foot. 32 W 5th St S is a home located in Oswego County with nearby schools including G Ray Bodley High School.
Ownership History
Date
Name
Owned For
Owner Type
Purchase Details
Closed on
May 19, 2009
Sold by
Household Finance Realty Corporation Of
Bought by
Limestone Ridge Llc
Current Estimated Value
Purchase Details
Closed on
Feb 13, 2009
Sold by
Lane Michael
Bought by
Household Finance Realty Corporation Of
Purchase Details
Closed on
Mar 29, 2005
Sold by
Williams Christopher J and Williams Veronica A
Bought by
Lane Michael
Home Financials for this Owner
Home Financials are based on the most recent Mortgage that was taken out on this home.
Original Mortgage
$57,902
Interest Rate
8.5%
Mortgage Type
Adjustable Rate Mortgage/ARM
Create a Home Valuation Report for This Property
The Home Valuation Report is an in-depth analysis detailing your home's value as well as a comparison with similar homes in the area
Home Values in the Area
Average Home Value in this Area
Purchase History
| Date | Buyer | Sale Price | Title Company |
|---|---|---|---|
| Limestone Ridge Llc | $37,000 | None Available | |
| Household Finance Realty Corporation Of | $67,939 | Webtitle Agency | |
| Lane Michael | $61,000 | Ticor-Jae |
Source: Public Records
Mortgage History
| Date | Status | Borrower | Loan Amount |
|---|---|---|---|
| Previous Owner | Lane Michael | $57,902 |
Source: Public Records
Tax History Compared to Growth
Tax History
| Year | Tax Paid | Tax Assessment Tax Assessment Total Assessment is a certain percentage of the fair market value that is determined by local assessors to be the total taxable value of land and additions on the property. | Land | Improvement |
|---|---|---|---|---|
| 2024 | $5,494 | $79,000 | $5,600 | $73,400 |
| 2023 | $3,840 | $79,000 | $5,600 | $73,400 |
| 2022 | $3,919 | $79,000 | $5,600 | $73,400 |
| 2021 | $4,169 | $69,300 | $9,600 | $59,700 |
| 2020 | $4,116 | $69,300 | $9,600 | $59,700 |
| 2019 | $4,048 | $69,300 | $9,600 | $59,700 |
| 2018 | $4,048 | $69,300 | $9,600 | $59,700 |
| 2017 | $4,025 | $69,300 | $9,600 | $59,700 |
| 2016 | $4,095 | $69,300 | $9,600 | $59,700 |
| 2015 | -- | $69,300 | $9,600 | $59,700 |
| 2014 | -- | $69,300 | $9,600 | $59,700 |
Source: Public Records
Map
Nearby Homes