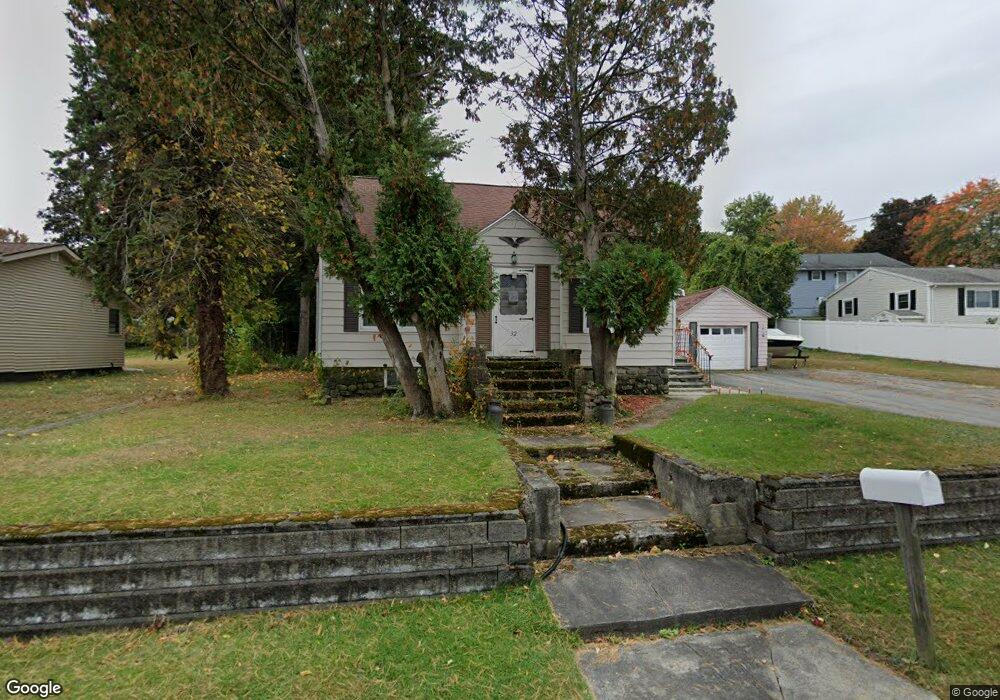
32 W Ayer St Methuen, MA 01844
The East End NeighborhoodEstimated Value: $318,000 - $579,000
3
Beds
1
Bath
2,183
Sq Ft
$227/Sq Ft
Est. Value
About This Home
This home is located at 32 W Ayer St, Methuen, MA 01844 and is currently estimated at $495,391, approximately $226 per square foot. 32 W Ayer St is a home located in Essex County with nearby schools including Timony Grammar School, South Point Elementary School, and Methuen High School.
Ownership History
Date
Name
Owned For
Owner Type
Purchase Details
Closed on
Nov 20, 2024
Sold by
Spinelli Ayer Rt and Spinelli
Bought by
Bryant Shayna and Troncoso Bernadette
Current Estimated Value
Home Financials for this Owner
Home Financials are based on the most recent Mortgage that was taken out on this home.
Original Mortgage
$160,000
Outstanding Balance
$158,308
Interest Rate
6.32%
Mortgage Type
Purchase Money Mortgage
Estimated Equity
$337,083
Purchase Details
Closed on
Apr 12, 2011
Sold by
Spinelli Rita
Bought by
Spinelli Ayer Rt
Purchase Details
Closed on
May 1, 1965
Bought by
Spinelli Ayer Rt
Create a Home Valuation Report for This Property
The Home Valuation Report is an in-depth analysis detailing your home's value as well as a comparison with similar homes in the area
Home Values in the Area
Average Home Value in this Area
Purchase History
| Date | Buyer | Sale Price | Title Company |
|---|---|---|---|
| Bryant Shayna | $300,000 | None Available | |
| Spinelli Ayer Rt | -- | -- | |
| Spinelli Ayer Rt | -- | -- | |
| Spinelli Ayer Rt | -- | -- |
Source: Public Records
Mortgage History
| Date | Status | Borrower | Loan Amount |
|---|---|---|---|
| Open | Bryant Shayna | $160,000 | |
| Closed | Bryant Shayna | $160,000 | |
| Previous Owner | Spinelli Ayer Rt | $20,000 | |
| Previous Owner | Spinelli Ayer Rt | $30,000 |
Source: Public Records
Tax History Compared to Growth
Tax History
| Year | Tax Paid | Tax Assessment Tax Assessment Total Assessment is a certain percentage of the fair market value that is determined by local assessors to be the total taxable value of land and additions on the property. | Land | Improvement |
|---|---|---|---|---|
| 2025 | $4,958 | $468,600 | $205,800 | $262,800 |
| 2024 | $4,894 | $450,600 | $187,800 | $262,800 |
| 2023 | $4,572 | $390,800 | $166,900 | $223,900 |
| 2022 | $4,297 | $329,300 | $139,100 | $190,200 |
| 2021 | $4,073 | $308,800 | $132,100 | $176,700 |
| 2020 | $4,078 | $303,400 | $132,100 | $171,300 |
| 2019 | $3,882 | $273,600 | $118,200 | $155,400 |
| 2018 | $3,789 | $265,500 | $118,200 | $147,300 |
| 2017 | $3,652 | $249,300 | $118,200 | $131,100 |
| 2016 | $3,390 | $228,900 | $111,300 | $117,600 |
| 2015 | $3,244 | $222,200 | $111,300 | $110,900 |
Source: Public Records
Map
Nearby Homes
- 49 Golf Ave
- 86 Comet Rd
- 6 Aberdeen Rd
- 2 Goodrich Ave
- 3 Thissell St
- 115 Merrimack Rd
- 29 Wallace St
- 5 Harmony Ln
- 29 Meadowbrook Rd
- 1 Riverview Blvd Unit 3-8
- 1 Riverview Blvd Unit 2-203
- 4 Alderbrook Ln
- 23 Constitution Way Unit 23
- 23 Constitution Way
- 95 Pilgrim Cir Unit 95
- 63 Lippold St
- 128 Pleasant Valley St
- 106 Leroy Ave
- 3 Woekel Terrace
- 15 Swan Ave