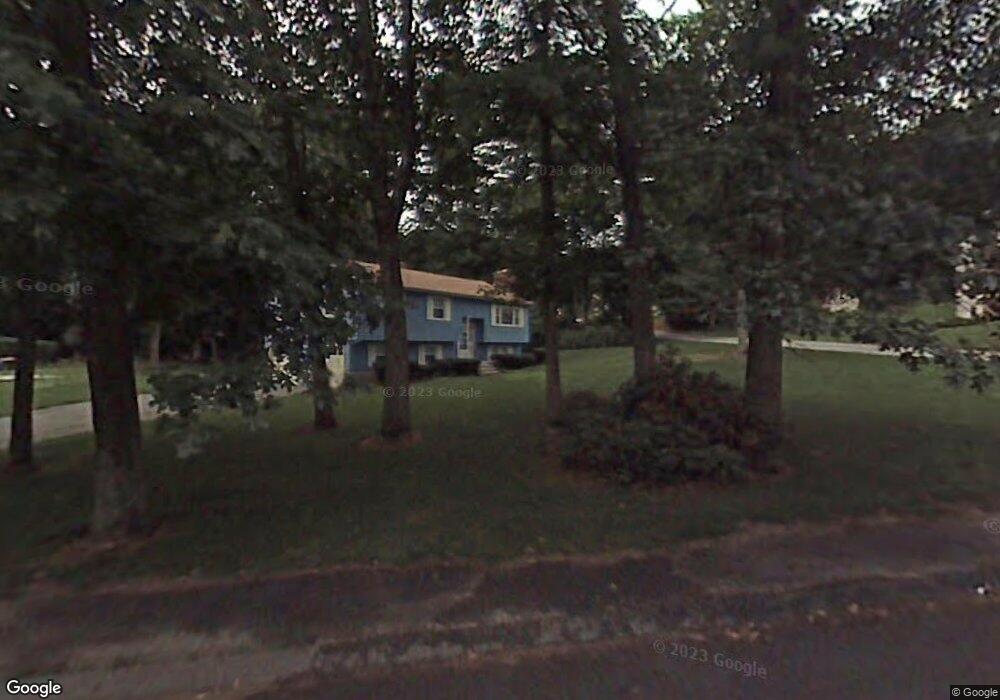
32 Wagon Wheel Rd Dracut, MA 01826
Estimated Value: $487,000 - $998,000
3
Beds
1
Bath
1,136
Sq Ft
$584/Sq Ft
Est. Value
About This Home
This home is located at 32 Wagon Wheel Rd, Dracut, MA 01826 and is currently estimated at $663,968, approximately $584 per square foot. 32 Wagon Wheel Rd is a home located in Middlesex County with nearby schools including Brookside Elementary School, Richardson Middle School, and Dracut Senior High School.
Ownership History
Date
Name
Owned For
Owner Type
Purchase Details
Closed on
May 24, 2005
Sold by
Carignan Charles L and Carignan Theresa G
Bought by
Tyler Jeffrey S and Tyler Rosita
Current Estimated Value
Home Financials for this Owner
Home Financials are based on the most recent Mortgage that was taken out on this home.
Original Mortgage
$279,200
Outstanding Balance
$146,604
Interest Rate
5.95%
Mortgage Type
Purchase Money Mortgage
Estimated Equity
$517,364
Purchase Details
Closed on
Nov 10, 1988
Sold by
Fuller Raymond R
Bought by
Carignan Charles L
Home Financials for this Owner
Home Financials are based on the most recent Mortgage that was taken out on this home.
Original Mortgage
$130,000
Interest Rate
10.36%
Mortgage Type
Purchase Money Mortgage
Create a Home Valuation Report for This Property
The Home Valuation Report is an in-depth analysis detailing your home's value as well as a comparison with similar homes in the area
Home Values in the Area
Average Home Value in this Area
Purchase History
| Date | Buyer | Sale Price | Title Company |
|---|---|---|---|
| Tyler Jeffrey S | $349,900 | -- | |
| Carignan Charles L | $165,000 | -- |
Source: Public Records
Mortgage History
| Date | Status | Borrower | Loan Amount |
|---|---|---|---|
| Open | Tyler Jeffrey S | $279,200 | |
| Previous Owner | Carignan Charles L | $50,000 | |
| Previous Owner | Carignan Charles L | $130,000 |
Source: Public Records
Tax History
| Year | Tax Paid | Tax Assessment Tax Assessment Total Assessment is a certain percentage of the fair market value that is determined by local assessors to be the total taxable value of land and additions on the property. | Land | Improvement |
|---|---|---|---|---|
| 2025 | $5,135 | $507,400 | $208,800 | $298,600 |
| 2024 | $5,346 | $511,600 | $198,900 | $312,700 |
| 2023 | $5,353 | $462,300 | $172,900 | $289,400 |
| 2022 | $4,915 | $399,900 | $157,100 | $242,800 |
| 2021 | $5,206 | $359,500 | $142,800 | $216,700 |
| 2020 | $4,412 | $330,500 | $138,500 | $192,000 |
| 2019 | $3,677 | $321,000 | $131,900 | $189,100 |
| 2018 | $4,705 | $302,000 | $131,900 | $170,100 |
| 2017 | $4,105 | $302,000 | $131,900 | $170,100 |
| 2016 | $3,931 | $264,900 | $126,800 | $138,100 |
| 2015 | $3,816 | $255,600 | $126,800 | $128,800 |
| 2014 | $3,705 | $255,700 | $126,800 | $128,900 |
Source: Public Records
Map
Nearby Homes
- 43 & 53 5th St
- 17 Spare St
- 1905 Lakeview Ave
- 29 Mill St Unit B
- 9 Cornstalk Ln
- 13 Dallas Dr Unit 305
- 13 Dallas Dr Unit 107
- 53 Vinal St
- 70 Faith Ave
- 94 Tennis Plaza Rd Unit 10
- 74 Tennis Plaza Rd Unit 34
- 83 Turgeon Ave
- 154 New Boston Rd
- 40 Westfall Rd
- 6 Wilshire Ln Unit 6
- 4 Wilshire Ln Unit 4
- 4 Wilshire Ln
- 1 Elm Grove Ave
- 2 Aspen Dr
- 2 Aspen Dr Unit Lot 146-17
Your Personal Tour Guide
Ask me questions while you tour the home.