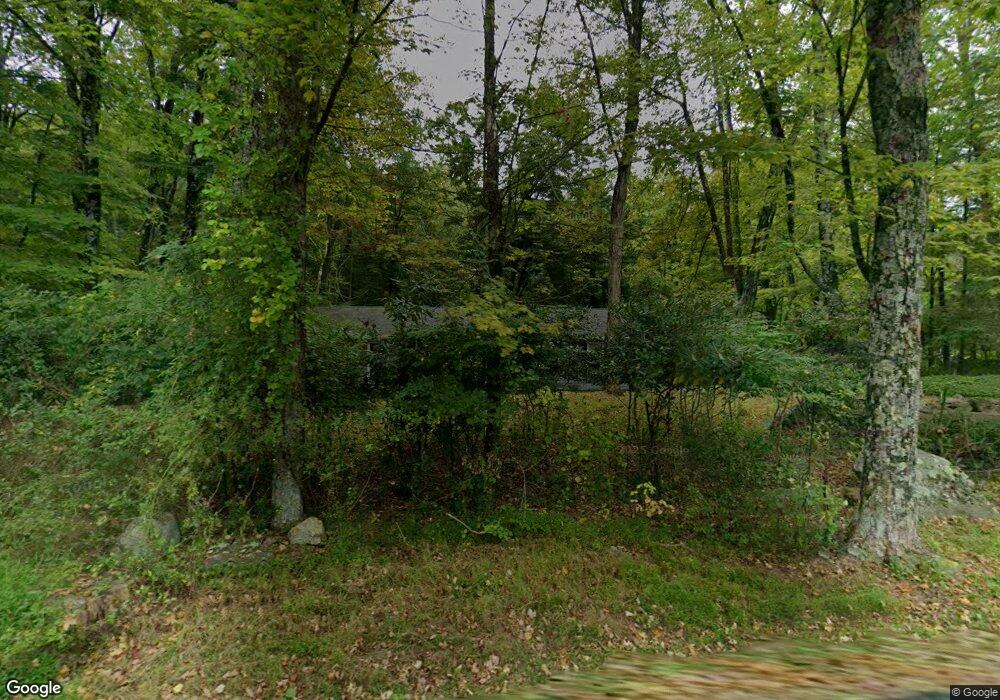
32 Water St Lebanon, NJ 08833
Estimated Value: $440,000 - $764,000
--
Bed
--
Bath
1,288
Sq Ft
$449/Sq Ft
Est. Value
About This Home
This home is located at 32 Water St, Lebanon, NJ 08833 and is currently estimated at $578,068, approximately $448 per square foot. 32 Water St is a home located in Hunterdon County with nearby schools including Old Turnpike School, Tewksbury Elementary School, and Voorhees High School.
Ownership History
Date
Name
Owned For
Owner Type
Purchase Details
Closed on
Jun 4, 2003
Sold by
Brause Pamela Lynn
Bought by
Garrett Charles B and Brause Pamela Lynn
Current Estimated Value
Home Financials for this Owner
Home Financials are based on the most recent Mortgage that was taken out on this home.
Original Mortgage
$243,500
Outstanding Balance
$104,107
Interest Rate
5.45%
Estimated Equity
$473,961
Purchase Details
Closed on
Jan 4, 1990
Sold by
Booth Galen W
Bought by
Brause Pamela Lynn
Create a Home Valuation Report for This Property
The Home Valuation Report is an in-depth analysis detailing your home's value as well as a comparison with similar homes in the area
Home Values in the Area
Average Home Value in this Area
Purchase History
| Date | Buyer | Sale Price | Title Company |
|---|---|---|---|
| Garrett Charles B | -- | -- | |
| Brause Pamela Lynn | -- | -- |
Source: Public Records
Mortgage History
| Date | Status | Borrower | Loan Amount |
|---|---|---|---|
| Open | Garrett Charles B | $243,500 |
Source: Public Records
Tax History Compared to Growth
Tax History
| Year | Tax Paid | Tax Assessment Tax Assessment Total Assessment is a certain percentage of the fair market value that is determined by local assessors to be the total taxable value of land and additions on the property. | Land | Improvement |
|---|---|---|---|---|
| 2025 | $9,582 | $394,500 | $212,800 | $181,700 |
| 2024 | $9,318 | $394,500 | $212,800 | $181,700 |
| 2023 | $9,318 | $394,500 | $212,800 | $181,700 |
| 2022 | $8,967 | $394,500 | $212,800 | $181,700 |
| 2021 | $8,556 | $394,500 | $212,800 | $181,700 |
| 2020 | $8,750 | $394,500 | $212,800 | $181,700 |
| 2019 | $8,556 | $331,000 | $252,300 | $78,700 |
| 2018 | $8,427 | $331,000 | $252,300 | $78,700 |
| 2017 | $8,331 | $331,000 | $252,300 | $78,700 |
| 2016 | $8,060 | $331,000 | $252,300 | $78,700 |
| 2015 | $7,802 | $331,000 | $252,300 | $78,700 |
| 2014 | $7,696 | $331,000 | $252,300 | $78,700 |
Source: Public Records
Map
Nearby Homes