
Seller's Agent in 2021
Tracy Spaniol
RE/MAX
(781) 526-0291
1 in this area
88 Total Sales
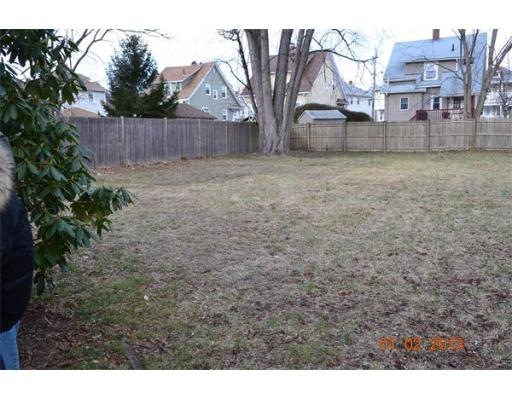
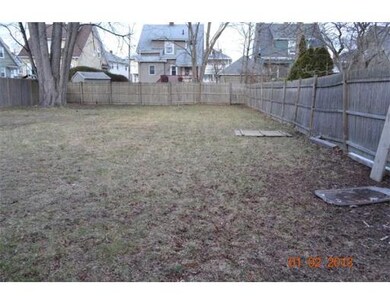
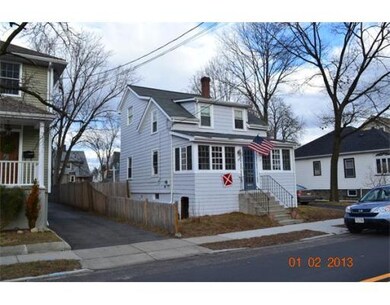
ONLY SERIOUS BUYERS AND CONTRACTORS WITH CASH !!! LAND ONLY!! Tear down and start new with a BEAUTIFUL 7352 sq ft level lot across from McNelly playground. With convenient access to Rt 93, public transportation, downtown Medford and downtown Boston. Buyers to perform all and any due diligence sold " as is "!!.
| Date | Type | Sale Price | Title Company |
|---|---|---|---|
| Not Resolvable | $780,000 | None Available | |
| Not Resolvable | $444,900 | -- | |
| Not Resolvable | $235,000 | -- | |
| Deed | $149,000 | -- | |
| Deed | $141,000 | -- |
| Date | Status | Loan Amount | Loan Type |
|---|---|---|---|
| Open | $663,000 | Purchase Money Mortgage | |
| Previous Owner | $164,000 | Stand Alone Refi Refinance Of Original Loan | |
| Previous Owner | $355,920 | New Conventional | |
| Previous Owner | $100,000 | No Value Available | |
| Previous Owner | $200,000 | No Value Available | |
| Previous Owner | $30,000 | No Value Available | |
| Previous Owner | $134,100 | Purchase Money Mortgage | |
| Previous Owner | $111,000 | No Value Available |
| Date | Event | Price | Change | Sq Ft Price |
|---|---|---|---|---|
| 08/31/2021 08/31/21 | Sold | $780,000 | +4.0% | $567 / Sq Ft |
| 07/20/2021 07/20/21 | Pending | -- | -- | -- |
| 07/14/2021 07/14/21 | For Sale | $749,900 | +68.6% | $545 / Sq Ft |
| 08/02/2013 08/02/13 | Sold | $444,900 | 0.0% | $330 / Sq Ft |
| 07/14/2013 07/14/13 | Pending | -- | -- | -- |
| 07/06/2013 07/06/13 | Off Market | $444,900 | -- | -- |
| 06/25/2013 06/25/13 | For Sale | $439,900 | +87.2% | $326 / Sq Ft |
| 03/15/2013 03/15/13 | Sold | $235,000 | -6.0% | $185 / Sq Ft |
| 02/13/2013 02/13/13 | Pending | -- | -- | -- |
| 02/04/2013 02/04/13 | For Sale | $249,900 | -- | $197 / Sq Ft |
| Year | Tax Paid | Tax Assessment Tax Assessment Total Assessment is a certain percentage of the fair market value that is determined by local assessors to be the total taxable value of land and additions on the property. | Land | Improvement |
|---|---|---|---|---|
| 2025 | $6,228 | $731,000 | $371,900 | $359,100 |
| 2024 | $6,228 | $731,000 | $371,900 | $359,100 |
| 2023 | $6,001 | $693,800 | $347,600 | $346,200 |
| 2022 | $5,608 | $622,400 | $316,000 | $306,400 |
| 2021 | $5,581 | $593,100 | $300,900 | $292,200 |
| 2020 | $5,492 | $598,300 | $300,900 | $297,400 |
| 2019 | $5,296 | $551,700 | $273,600 | $278,100 |
| 2018 | $5,000 | $488,300 | $248,700 | $239,600 |
| 2017 | $4,769 | $451,600 | $232,400 | $219,200 |
| 2016 | $4,606 | $411,600 | $211,300 | $200,300 |
| 2015 | $4,541 | $388,100 | $201,200 | $186,900 |
Seller's Agent in 2021
Tracy Spaniol
RE/MAX
(781) 526-0291
1 in this area
88 Total Sales
Buyer's Agent in 2021
David Ladner
RE/MAX
1 in this area
312 Total Sales
Seller's Agent in 2013
Joan Barker
Laer Realty
(617) 216-7455
1 in this area
32 Total Sales
Seller's Agent in 2013
Hudson Santana
Keller Williams Realty Boston Northwest
(617) 272-0842
5 in this area
512 Total Sales
N
Buyer's Agent in 2013
Nelson Oliveira
Advantage Real Estate
(617) 590-0068
2 Total Sales
R
Buyer's Agent in 2013
Ryan Williams
Flow Realty, Inc.
Source: MLS Property Information Network (MLS PIN)
MLS Number: 71479225
APN: MEDF-000010-000000-K000067
Disclaimer: Certain information contained herein is derived from information provided by parties other than Homes.com. All information provided is deemed reliable, but is not guaranteed to be accurate and should be independently verified.
![]() The property listing data and information, or the Images, set forth herein were provided to MLS Property Information Network, Inc. from third party sources, including sellers, lessors and public records, and were compiled by MLS Property Information Network, Inc. The property listing data and information, and the Images, are for the personal, non-commercial use of consumers having a good faith interest in purchasing or leasing listed properties of the type displayed to them and may not be used for any purpose other than to identify prospective properties which such consumers may have a good faith interest in purchasing or leasing. MLS Property Information Network, Inc. and its subscribers disclaim any and all representations and warranties as to the accuracy of the property listing data and information, or as to the accuracy of any of the Images, set forth herein.
The property listing data and information, or the Images, set forth herein were provided to MLS Property Information Network, Inc. from third party sources, including sellers, lessors and public records, and were compiled by MLS Property Information Network, Inc. The property listing data and information, and the Images, are for the personal, non-commercial use of consumers having a good faith interest in purchasing or leasing listed properties of the type displayed to them and may not be used for any purpose other than to identify prospective properties which such consumers may have a good faith interest in purchasing or leasing. MLS Property Information Network, Inc. and its subscribers disclaim any and all representations and warranties as to the accuracy of the property listing data and information, or as to the accuracy of any of the Images, set forth herein.