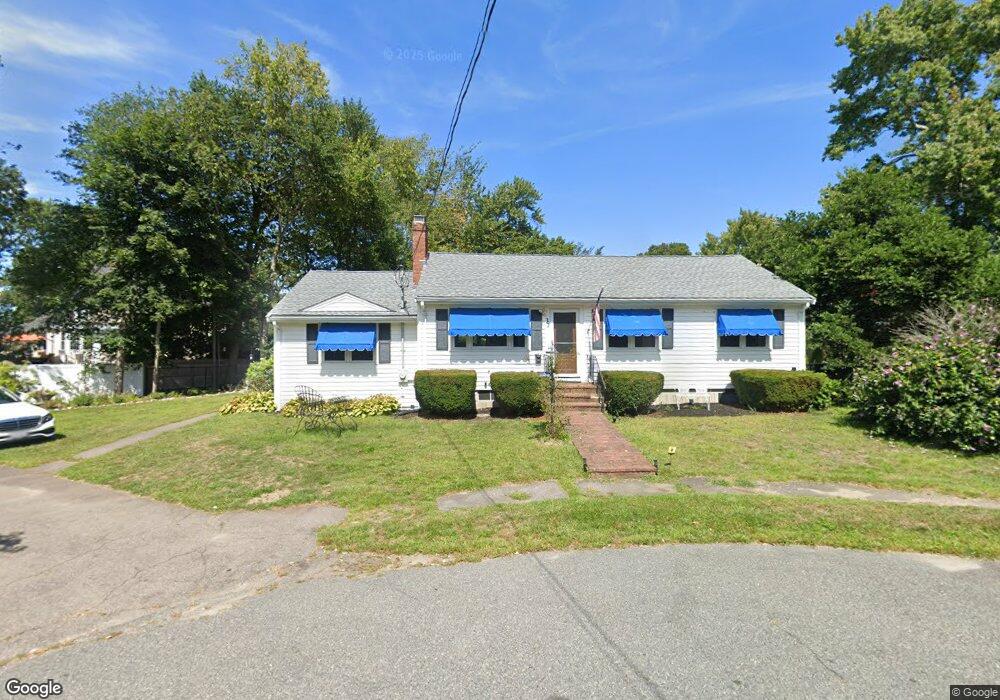
32 Welland Cir Weymouth, MA 02188
Weymouth Landing NeighborhoodEstimated Value: $617,000 - $686,000
2
Beds
1
Bath
1,560
Sq Ft
$417/Sq Ft
Est. Value
About This Home
This home is located at 32 Welland Cir, Weymouth, MA 02188 and is currently estimated at $651,201, approximately $417 per square foot. 32 Welland Cir is a home located in Norfolk County with nearby schools including Frederick C Murphy, Abigail Adams Middle School, and Weymouth Middle School Chapman.
Ownership History
Date
Name
Owned For
Owner Type
Purchase Details
Closed on
Feb 24, 2017
Sold by
Tobin Francine A
Bought by
Gorman Ann L
Current Estimated Value
Home Financials for this Owner
Home Financials are based on the most recent Mortgage that was taken out on this home.
Original Mortgage
$175,000
Outstanding Balance
$144,917
Interest Rate
4.12%
Mortgage Type
Unknown
Estimated Equity
$506,284
Create a Home Valuation Report for This Property
The Home Valuation Report is an in-depth analysis detailing your home's value as well as a comparison with similar homes in the area
Home Values in the Area
Average Home Value in this Area
Purchase History
| Date | Buyer | Sale Price | Title Company |
|---|---|---|---|
| Gorman Ann L | -- | -- |
Source: Public Records
Mortgage History
| Date | Status | Borrower | Loan Amount |
|---|---|---|---|
| Open | Gorman Ann L | $175,000 |
Source: Public Records
Tax History Compared to Growth
Tax History
| Year | Tax Paid | Tax Assessment Tax Assessment Total Assessment is a certain percentage of the fair market value that is determined by local assessors to be the total taxable value of land and additions on the property. | Land | Improvement |
|---|---|---|---|---|
| 2025 | $6,145 | $608,400 | $243,200 | $365,200 |
| 2024 | $5,952 | $579,600 | $231,700 | $347,900 |
| 2023 | $5,662 | $541,800 | $214,500 | $327,300 |
| 2022 | $5,564 | $485,500 | $198,600 | $286,900 |
| 2021 | $5,214 | $444,100 | $198,600 | $245,500 |
| 2020 | $4,996 | $419,100 | $198,600 | $220,500 |
| 2019 | $4,398 | $362,900 | $191,000 | $171,900 |
| 2018 | $4,271 | $341,700 | $182,500 | $159,200 |
| 2017 | $4,168 | $325,400 | $173,800 | $151,600 |
| 2016 | $4,005 | $312,900 | $167,100 | $145,800 |
| 2015 | $3,769 | $292,200 | $159,500 | $132,700 |
| 2014 | $3,850 | $289,500 | $148,500 | $141,000 |
Source: Public Records
Map
Nearby Homes
- 33 Congress St
- 24 Blake Rd
- 54 Federal St
- 76 Kingman St
- 48 Apple Tree Ln
- 16 Lindbergh Ave
- 23-25 Lindbergh Ave
- 15 Summer St
- 19 Vine St Unit 3
- 19 Vine St Unit 1
- 114 Broad St Unit D
- 114 Broad St Unit C
- 11 Richmond St
- 122 Washington St Unit 22
- 286 Broad St
- 12 Klasson Ln
- 36 Brookside Rd
- 42 Sundin Rd
- 286 Essex St
- 37 Lantern Ln