32 Weston Way Fletcher, NC 28732
Estimated Value: $606,000 - $869,000
4
Beds
4
Baths
3,353
Sq Ft
$221/Sq Ft
Est. Value
About This Home
This home is located at 32 Weston Way, Fletcher, NC 28732 and is currently estimated at $741,532, approximately $221 per square foot. 32 Weston Way is a home located in Henderson County with nearby schools including Fletcher Elementary School, Apple Valley Middle School, and North Henderson High School.
Ownership History
Date
Name
Owned For
Owner Type
Purchase Details
Closed on
Aug 6, 2021
Sold by
Holt Fraser Karen Renee and Holt Gordon B
Bought by
Karen Renee Holt Fraser Gordon B Fraser Livin
Current Estimated Value
Home Financials for this Owner
Home Financials are based on the most recent Mortgage that was taken out on this home.
Original Mortgage
$100,000
Interest Rate
2.9%
Mortgage Type
New Conventional
Purchase Details
Closed on
Oct 13, 2011
Sold by
Crouch David T
Bought by
Fraser Gordon B
Purchase Details
Closed on
Apr 8, 2005
Sold by
Not Provided
Bought by
Crouch David T
Home Financials for this Owner
Home Financials are based on the most recent Mortgage that was taken out on this home.
Original Mortgage
$337,250
Interest Rate
5.62%
Mortgage Type
Purchase Money Mortgage
Create a Home Valuation Report for This Property
The Home Valuation Report is an in-depth analysis detailing your home's value as well as a comparison with similar homes in the area
Home Values in the Area
Average Home Value in this Area
Purchase History
| Date | Buyer | Sale Price | Title Company |
|---|---|---|---|
| Karen Renee Holt Fraser Gordon B Fraser Livin | -- | Stephen Barnwell Pllc | |
| Fraser Karen Renee Holt | -- | Stephen Barnwell Pllc | |
| Fraser Gordon B | -- | -- | |
| Fraser Gordon B | -- | -- | |
| Crouch David T | $355,000 | -- |
Source: Public Records
Mortgage History
| Date | Status | Borrower | Loan Amount |
|---|---|---|---|
| Closed | Fraser Karen Renee Holt | $100,000 | |
| Previous Owner | Crouch David T | $337,250 |
Source: Public Records
Tax History Compared to Growth
Tax History
| Year | Tax Paid | Tax Assessment Tax Assessment Total Assessment is a certain percentage of the fair market value that is determined by local assessors to be the total taxable value of land and additions on the property. | Land | Improvement |
|---|---|---|---|---|
| 2025 | $2,863 | $534,100 | $96,200 | $437,900 |
| 2024 | $2,863 | $534,100 | $96,200 | $437,900 |
| 2023 | $2,863 | $534,100 | $96,200 | $437,900 |
| 2022 | $2,441 | $361,100 | $54,600 | $306,500 |
| 2021 | $2,441 | $361,100 | $54,600 | $306,500 |
| 2020 | $2,441 | $361,100 | $0 | $0 |
| 2019 | $2,441 | $361,100 | $0 | $0 |
| 2018 | $2,434 | $358,000 | $0 | $0 |
| 2017 | $2,434 | $358,000 | $0 | $0 |
| 2016 | $2,434 | $358,000 | $0 | $0 |
| 2015 | -- | $358,000 | $0 | $0 |
| 2014 | -- | $325,200 | $0 | $0 |
Source: Public Records
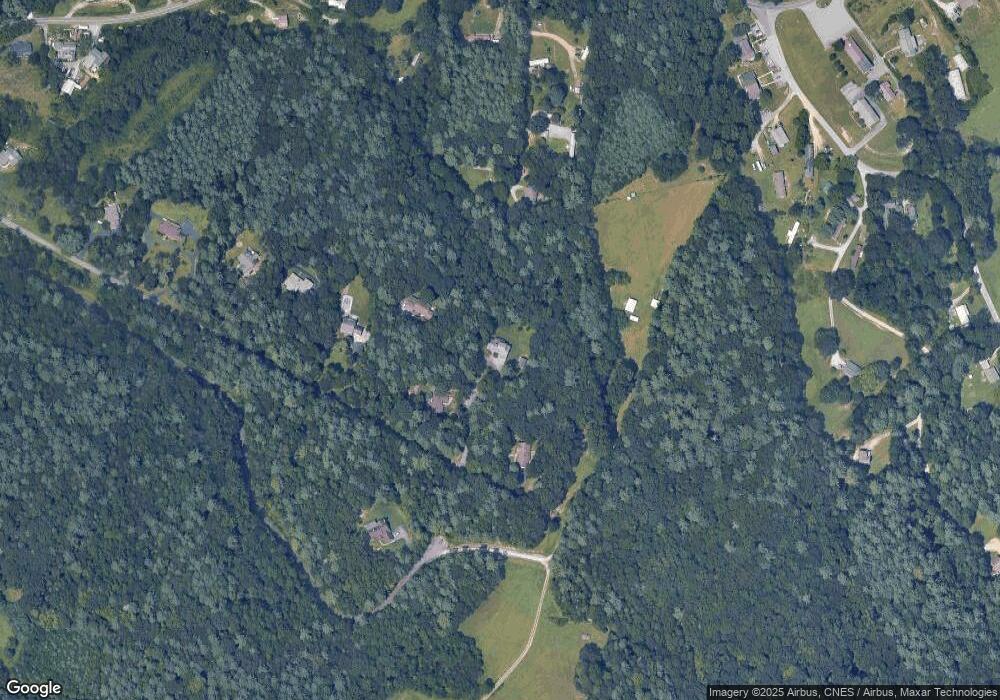
Map
Nearby Homes
- 428 Jackson Rd
- 4 Peaceful Ln
- 145 Bovine Branch Rd
- 119 Bovine Branch Rd
- 131 Bovine Branch Rd
- 46 Beale Ct
- 242 Pattys Chapel Rd
- 620 Hutch Mountain Rd
- 12 Hutchinson Woods
- 133 Little Pine Dr
- 152 S Sunberry Trail
- 99 Relaxing View Dr
- 135 S Sunberry Trail
- 590 Hutch Mountain Rd
- 107 S Sunberry Trail
- 239 Yellowstone Dr
- 134 Olivia Trace Dr
- 32 White Fox Dr
- 235 Olivet Ln
- 80 Hoopers Creek Rd
- 35 Weston Way
- 29 Weston Way
- 30 Weston Way
- 515 Cadbury Way
- 25 Weston Way
- 210 Cord Wood Trail
- 516 Cadbury Way
- 21 Weston Way
- 491 Cadbury Way
- 19 Weston Way
- 15 Weston Way
- 61 Talmadge Ln
- 98 Flynn Branch Rd
- 41 Talmadge Ln
- 394 Jackson Rd
- 20 Flynn Branch Rd
- 442 Jackson Rd
- 9 Weston Way
- 136 Flynn Branch Rd
- 138 Flynn Branch Rd