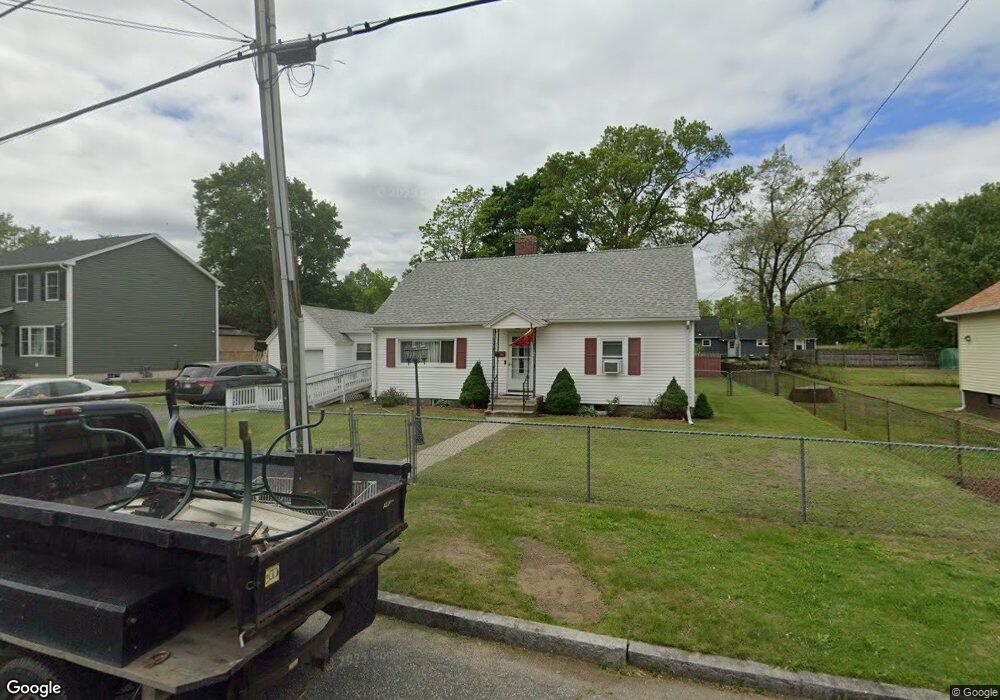
32 Wilton St Springfield, MA 01109
Pine Point NeighborhoodEstimated Value: $319,000 - $400,000
4
Beds
3
Baths
1,956
Sq Ft
$180/Sq Ft
Est. Value
About This Home
This home is located at 32 Wilton St, Springfield, MA 01109 and is currently estimated at $352,271, approximately $180 per square foot. 32 Wilton St is a home located in Hampden County with nearby schools including Thomas M Balliet Elementary School, John J Duggan Middle, and Roger L. Putnam Vocational Technical Academy.
Ownership History
Date
Name
Owned For
Owner Type
Purchase Details
Closed on
Apr 16, 1998
Sold by
Bailey Gale C
Bought by
Ocasio Justo and Ramos Carmen M
Current Estimated Value
Home Financials for this Owner
Home Financials are based on the most recent Mortgage that was taken out on this home.
Original Mortgage
$83,874
Outstanding Balance
$14,993
Interest Rate
7.11%
Mortgage Type
Purchase Money Mortgage
Estimated Equity
$337,278
Create a Home Valuation Report for This Property
The Home Valuation Report is an in-depth analysis detailing your home's value as well as a comparison with similar homes in the area
Home Values in the Area
Average Home Value in this Area
Purchase History
| Date | Buyer | Sale Price | Title Company |
|---|---|---|---|
| Ocasio Justo | $84,000 | -- |
Source: Public Records
Mortgage History
| Date | Status | Borrower | Loan Amount |
|---|---|---|---|
| Open | Ocasio Justo | $30,000 | |
| Open | Ocasio Justo | $83,874 | |
| Previous Owner | Ocasio Justo | $33,500 | |
| Previous Owner | Ocasio Justo | $20,000 |
Source: Public Records
Tax History
| Year | Tax Paid | Tax Assessment Tax Assessment Total Assessment is a certain percentage of the fair market value that is determined by local assessors to be the total taxable value of land and additions on the property. | Land | Improvement |
|---|---|---|---|---|
| 2025 | $4,433 | $282,700 | $42,600 | $240,100 |
| 2024 | $4,494 | $279,800 | $35,500 | $244,300 |
| 2023 | $4,148 | $243,300 | $32,300 | $211,000 |
| 2022 | $3,612 | $191,900 | $30,200 | $161,700 |
| 2021 | $3,204 | $169,500 | $27,500 | $142,000 |
| 2020 | $3,068 | $157,100 | $27,500 | $129,600 |
| 2019 | $2,952 | $150,000 | $27,500 | $122,500 |
| 2018 | $3,031 | $154,000 | $27,500 | $126,500 |
| 2017 | $2,925 | $148,800 | $25,300 | $123,500 |
| 2016 | $2,538 | $129,100 | $25,300 | $103,800 |
| 2015 | $2,492 | $126,700 | $25,300 | $101,400 |
Source: Public Records
Map
Nearby Homes
Your Personal Tour Guide
Ask me questions while you tour the home.