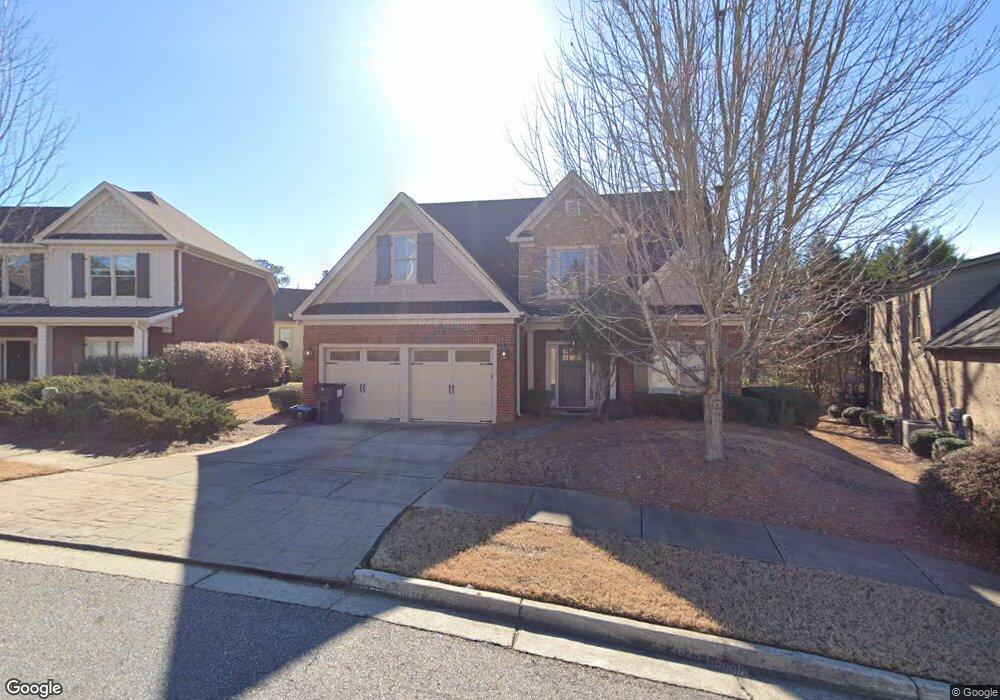
320 Abington Ln Athens, GA 30606
Tanglewood NeighborhoodEstimated Value: $422,163 - $455,000
4
Beds
4
Baths
2,278
Sq Ft
$191/Sq Ft
Est. Value
About This Home
This home is located at 320 Abington Ln, Athens, GA 30606 and is currently estimated at $434,041, approximately $190 per square foot. 320 Abington Ln is a home located in Clarke County with nearby schools including Timothy Elementary School, Clarke Middle School, and Clarke Central High School.
Ownership History
Date
Name
Owned For
Owner Type
Purchase Details
Closed on
May 31, 2022
Sold by
Chen Gang
Bought by
Mccathy Allison
Current Estimated Value
Home Financials for this Owner
Home Financials are based on the most recent Mortgage that was taken out on this home.
Original Mortgage
$340,200
Outstanding Balance
$322,777
Interest Rate
5.27%
Mortgage Type
New Conventional
Estimated Equity
$111,264
Purchase Details
Closed on
Mar 17, 2011
Sold by
Multibank 2010-1 Sfr Venture
Bought by
Chen Gang
Home Financials for this Owner
Home Financials are based on the most recent Mortgage that was taken out on this home.
Original Mortgage
$119,200
Interest Rate
4.95%
Mortgage Type
New Conventional
Purchase Details
Closed on
Jul 6, 2010
Sold by
Walton Enterprises Inc
Bought by
Multibank 2010 1 Sfr Venture L
Purchase Details
Closed on
Sep 29, 2006
Sold by
Not Provided
Bought by
Multibank 2010 1 Sfr Venture L
Create a Home Valuation Report for This Property
The Home Valuation Report is an in-depth analysis detailing your home's value as well as a comparison with similar homes in the area
Home Values in the Area
Average Home Value in this Area
Purchase History
| Date | Buyer | Sale Price | Title Company |
|---|---|---|---|
| Mccathy Allison | $378,000 | -- | |
| Chen Gang | $149,000 | -- | |
| Multibank 2010 1 Sfr Venture L | $179,450 | -- | |
| Multibank 2010 1 Sfr Venture L | $55,000 | -- |
Source: Public Records
Mortgage History
| Date | Status | Borrower | Loan Amount |
|---|---|---|---|
| Open | Mccathy Allison | $340,200 | |
| Previous Owner | Chen Gang | $119,200 |
Source: Public Records
Tax History Compared to Growth
Tax History
| Year | Tax Paid | Tax Assessment Tax Assessment Total Assessment is a certain percentage of the fair market value that is determined by local assessors to be the total taxable value of land and additions on the property. | Land | Improvement |
|---|---|---|---|---|
| 2025 | $5,032 | $162,070 | $14,000 | $148,070 |
| 2024 | $5,032 | $156,144 | $14,000 | $142,144 |
| 2023 | $4,880 | $150,926 | $14,000 | $136,926 |
| 2022 | $3,981 | $124,802 | $14,000 | $110,802 |
| 2021 | $3,586 | $106,398 | $14,000 | $92,398 |
| 2020 | $3,383 | $100,374 | $14,000 | $86,374 |
| 2019 | $3,291 | $96,940 | $14,000 | $82,940 |
| 2018 | $3,066 | $90,298 | $12,000 | $78,298 |
| 2017 | $2,923 | $86,097 | $12,000 | $74,097 |
| 2016 | $2,623 | $77,248 | $12,000 | $65,248 |
| 2015 | $2,572 | $75,648 | $12,000 | $63,648 |
| 2014 | $1,978 | $68,081 | $12,000 | $56,081 |
Source: Public Records
Map
Nearby Homes
- 205 Heritage Stroll
- 190 Bowles Dr Unit 1
- 190 Bowles Dr
- 132 Branford Place
- 102 Branford Place
- 101 Middleton Ct
- 200 Cheatham Dr
- 105 Greystone Terrace
- 835 Timothy Rd
- 497 Somerset Dr
- 299 Kennington Dr
- 145 Holly Falls Dr
- 164 Plum Nelly Rd
- 155 Harold Dr
- 262 Rhodes Dr
- 1720 Timothy Rd
- 560 Fortson Rd Unit Tract 2
- 127 Chestnut Ln
- 0 Abington Ln Unit 3211645
- 0 Abington Ln Unit 3151845
- 310 Abington Ln
- 240 Heritage Stroll Unit LOT J1
- 240 Heritage Stroll
- 212 Township Ln
- 216 Township Ln
- 300 Abington Ln
- 300 Abington Ln Unit 4J
- 325 Abington Ln
- 315 Abington Ln
- 315 Abington Ln Unit 4i
- 220 Township Ln
- 137 Towns Walk Dr Unit 5J
- 137 Towns Walk Dr
- 220 Heritage Stroll
- 210 Heritage Stroll
- 141 Towns Walk Dr Unit 6J
- 141 Towns Walk Dr
- 121 Towns Walk Dr