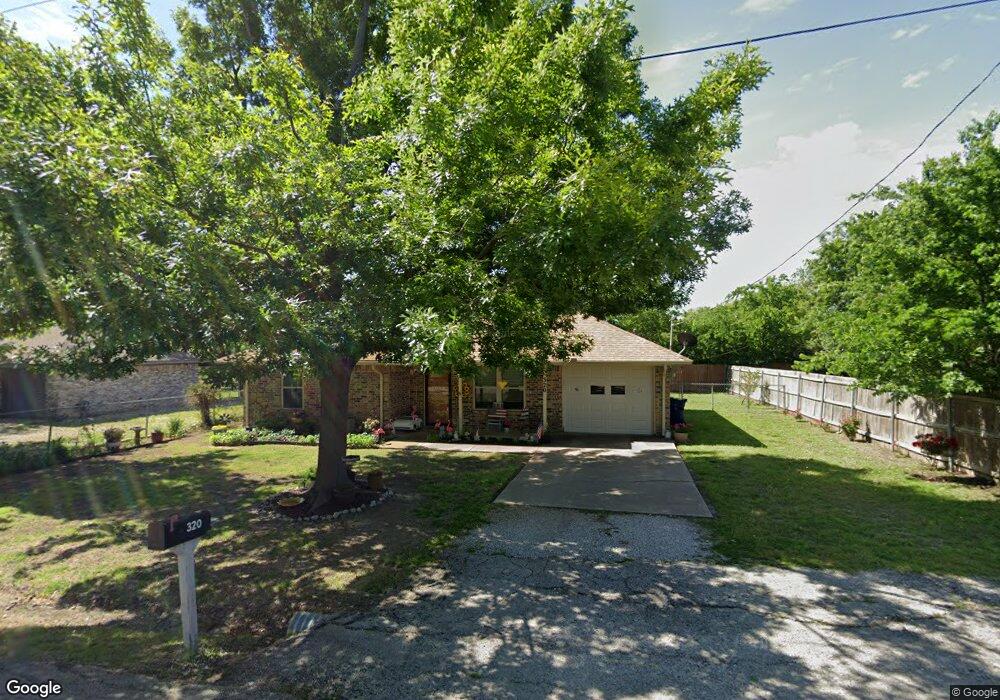
320 Austin St Sanger, TX 76266
Estimated Value: $216,921 - $283,000
Studio
2
Baths
1,021
Sq Ft
$233/Sq Ft
Est. Value
About This Home
This home is located at 320 Austin St, Sanger, TX 76266 and is currently estimated at $238,230, approximately $233 per square foot. 320 Austin St is a home located in Denton County with nearby schools including Butterfield Elementary School, Clear Creek Intermediate School, and Sanger Sixth Grade Campus.
Ownership History
Date
Name
Owned For
Owner Type
Purchase Details
Closed on
Dec 11, 2012
Sold by
Rhoades Marcella Clydene Romines and Romines Eddie Lee
Bought by
Howard Beverly
Current Estimated Value
Home Financials for this Owner
Home Financials are based on the most recent Mortgage that was taken out on this home.
Original Mortgage
$51,000
Outstanding Balance
$35,401
Interest Rate
3.41%
Mortgage Type
Purchase Money Mortgage
Estimated Equity
$202,829
Create a Home Valuation Report for This Property
The Home Valuation Report is an in-depth analysis detailing your home's value as well as a comparison with similar homes in the area
Home Values in the Area
Average Home Value in this Area
Purchase History
| Date | Buyer | Sale Price | Title Company |
|---|---|---|---|
| Howard Beverly | -- | None Available |
Source: Public Records
Mortgage History
| Date | Status | Borrower | Loan Amount |
|---|---|---|---|
| Open | Howard Beverly | $51,000 |
Source: Public Records
Tax History
| Year | Tax Paid | Tax Assessment Tax Assessment Total Assessment is a certain percentage of the fair market value that is determined by local assessors to be the total taxable value of land and additions on the property. | Land | Improvement |
|---|---|---|---|---|
| 2025 | $1,116 | $191,772 | $63,000 | $134,698 |
| 2024 | $3,523 | $174,338 | $0 | $0 |
| 2023 | $1,006 | $158,489 | $49,000 | $127,336 |
| 2022 | $3,195 | $144,081 | $38,500 | $135,161 |
| 2021 | $2,753 | $160,924 | $31,500 | $129,424 |
| 2020 | $2,635 | $119,075 | $31,500 | $99,863 |
| 2019 | $2,465 | $108,250 | $31,500 | $103,362 |
| 2018 | $2,253 | $98,409 | $31,500 | $84,297 |
| 2017 | $2,058 | $89,463 | $31,500 | $76,171 |
| 2016 | $1,871 | $81,330 | $17,500 | $64,913 |
| 2015 | $1,477 | $73,936 | $17,500 | $56,436 |
| 2013 | -- | $68,700 | $17,500 | $51,200 |
Source: Public Records
Map
Nearby Homes
- 505 Houston St
- 500 W Willow St
- TBD Church St
- Tbd Church St
- TBD Railroad Ave
- 710 W Willow St
- 113 Diane Dr
- 188 Aster Dr
- 185 Aster Dr
- 102 E Willow St
- 117 Kathryn Dr
- 921 First St
- 928 W Willow St
- 0000 Rector Rd
- 226 Hillcrest St
- 223 Jones St
- 124 Morning Glory
- 309 Railroad Ave
- 307 Railroad Ave
- 315 Jones St
Your Personal Tour Guide
Ask me questions while you tour the home.