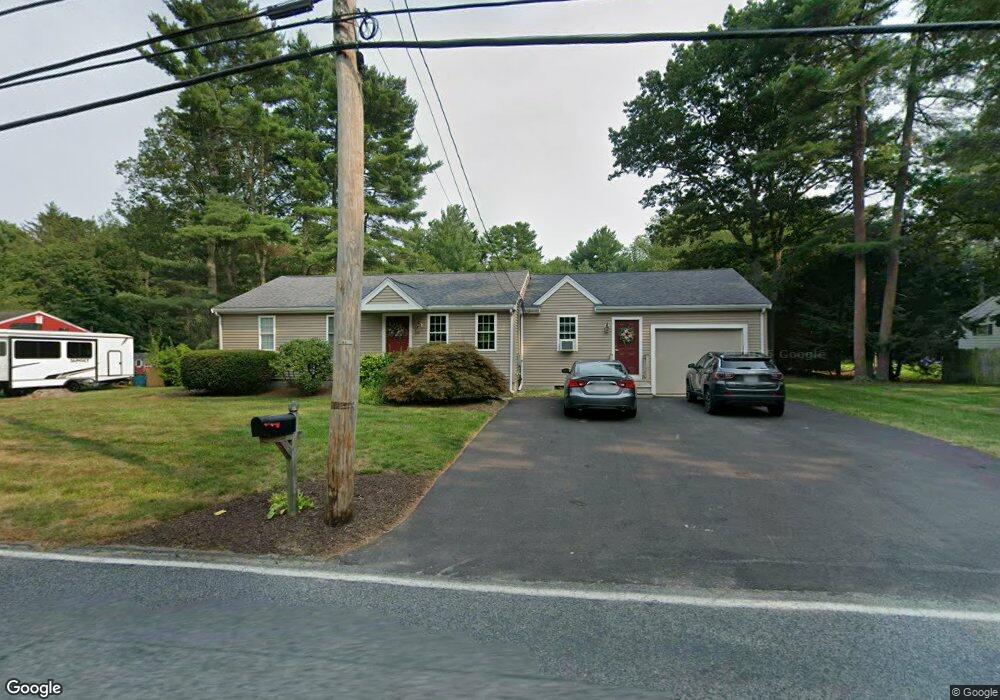
320 Balcom St Mansfield, MA 02048
Estimated Value: $601,439 - $676,000
3
Beds
1
Bath
1,406
Sq Ft
$454/Sq Ft
Est. Value
About This Home
This home is located at 320 Balcom St, Mansfield, MA 02048 and is currently estimated at $638,610, approximately $454 per square foot. 320 Balcom St is a home located in Bristol County with nearby schools including Everett W. Robinson Elementary School, Jordan/Jackson Elementary School, and Harold L. Qualters Middle School.
Ownership History
Date
Name
Owned For
Owner Type
Purchase Details
Closed on
Dec 30, 2025
Sold by
Fiedler Cynthia M
Bought by
Fiedler Ft and Fiedler
Current Estimated Value
Purchase Details
Closed on
Aug 5, 2008
Sold by
Fiedler Dana A and Fiedler Cynthia M
Bought by
Fiedler Cynthia M
Purchase Details
Closed on
Dec 1, 1988
Sold by
Hauger David
Bought by
Fiedler Dana
Create a Home Valuation Report for This Property
The Home Valuation Report is an in-depth analysis detailing your home's value as well as a comparison with similar homes in the area
Home Values in the Area
Average Home Value in this Area
Purchase History
| Date | Buyer | Sale Price | Title Company |
|---|---|---|---|
| Fiedler Ft | -- | -- | |
| Fiedler Cynthia M | -- | -- | |
| Fiedler Dana | $148,900 | -- |
Source: Public Records
Mortgage History
| Date | Status | Borrower | Loan Amount |
|---|---|---|---|
| Previous Owner | Fiedler Dana | $236,500 | |
| Previous Owner | Fiedler Dana | $250,000 |
Source: Public Records
Tax History
| Year | Tax Paid | Tax Assessment Tax Assessment Total Assessment is a certain percentage of the fair market value that is determined by local assessors to be the total taxable value of land and additions on the property. | Land | Improvement |
|---|---|---|---|---|
| 2025 | $6,667 | $506,200 | $252,400 | $253,800 |
| 2024 | $6,198 | $459,100 | $252,400 | $206,700 |
| 2023 | $6,090 | $432,200 | $252,400 | $179,800 |
| 2022 | $5,913 | $389,800 | $233,700 | $156,100 |
| 2021 | $3,132 | $370,100 | $204,500 | $165,600 |
| 2020 | $2,996 | $355,200 | $194,700 | $160,500 |
| 2019 | $2,821 | $331,100 | $162,200 | $168,900 |
| 2018 | $3,766 | $303,600 | $154,800 | $148,800 |
| 2017 | $2,658 | $307,700 | $150,500 | $157,200 |
| 2016 | $4,514 | $292,900 | $143,100 | $149,800 |
| 2015 | $4,156 | $268,100 | $143,100 | $125,000 |
Source: Public Records
Map
Nearby Homes
Your Personal Tour Guide
Ask me questions while you tour the home.