Estimated Value: $458,000 - $772,000
3
Beds
3
Baths
2,838
Sq Ft
$222/Sq Ft
Est. Value
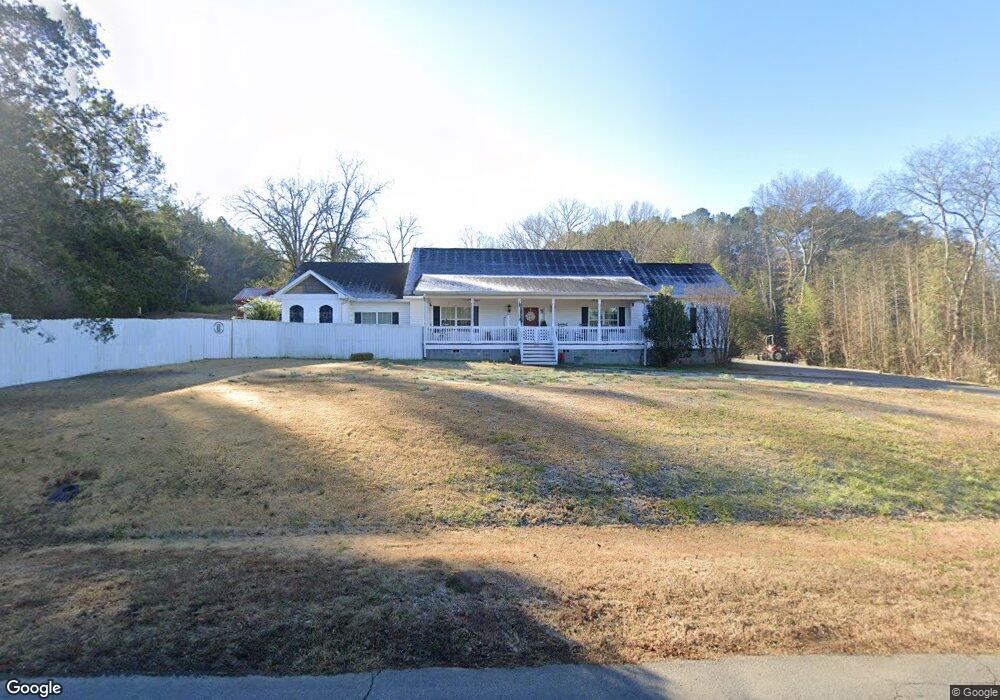
About This Home
This home is located at 320 Biddy Rd SE, Rome, GA 30161 and is currently estimated at $630,686, approximately $222 per square foot. 320 Biddy Rd SE is a home located in Floyd County with nearby schools including Pepperell Middle School and Pepperell High School.
Ownership History
Date
Name
Owned For
Owner Type
Purchase Details
Closed on
Feb 17, 2025
Sold by
Waters Michael Todd
Bought by
Michael Todd Waters Revocable Living Tru and Waters Michael Todd Trust
Current Estimated Value
Purchase Details
Closed on
Nov 19, 2008
Bought by
P and R
Purchase Details
Closed on
Jan 14, 2005
Sold by
Waters Michael Todd
Bought by
Waters Michael Todd and Waters Cindy
Purchase Details
Closed on
Jul 2, 2002
Bought by
P and R
Purchase Details
Closed on
May 31, 2001
Sold by
Minshew Brian W and Minshew Kellie B
Bought by
Waters Michael T
Purchase Details
Closed on
Dec 5, 1996
Sold by
Smith Calvin D and Teresa Joyce Smith
Bought by
Minshew Brian W and Minshew Kellie B
Purchase Details
Closed on
Jun 24, 1993
Sold by
Smith Calvin D
Bought by
Smith Calvin D and Teresa Joyce Smith
Purchase Details
Closed on
Jun 21, 1989
Sold by
Smith Edna Mrs
Bought by
Smith Calvin D
Purchase Details
Closed on
Dec 2, 1976
Bought by
Smith Edna Mrs
Create a Home Valuation Report for This Property
The Home Valuation Report is an in-depth analysis detailing your home's value as well as a comparison with similar homes in the area
Home Values in the Area
Average Home Value in this Area
Purchase History
| Date | Buyer | Sale Price | Title Company |
|---|---|---|---|
| Michael Todd Waters Revocable Living Tru | -- | -- | |
| P | -- | -- | |
| Waters Michael Todd | -- | -- | |
| P | -- | -- | |
| Waters Michael T | $95,500 | -- | |
| Minshew Brian W | $78,000 | -- | |
| Smith Calvin D | -- | -- | |
| Smith Calvin D | $20,000 | -- | |
| Smith Edna Mrs | $15,000 | -- |
Source: Public Records
Tax History Compared to Growth
Tax History
| Year | Tax Paid | Tax Assessment Tax Assessment Total Assessment is a certain percentage of the fair market value that is determined by local assessors to be the total taxable value of land and additions on the property. | Land | Improvement |
|---|---|---|---|---|
| 2024 | $5,142 | $248,674 | $20,444 | $228,230 |
| 2023 | $5,173 | $215,789 | $18,586 | $197,203 |
| 2022 | $3,805 | $160,365 | $15,372 | $144,993 |
| 2021 | $3,293 | $130,719 | $13,986 | $116,733 |
| 2020 | $2,949 | $110,597 | $12,162 | $98,435 |
| 2019 | $2,837 | $106,165 | $12,162 | $94,003 |
| 2018 | $2,747 | $100,954 | $11,584 | $89,370 |
| 2017 | $2,641 | $94,834 | $10,726 | $84,108 |
| 2016 | $2,646 | $93,364 | $10,720 | $82,644 |
| 2015 | $2,439 | $90,964 | $10,720 | $80,244 |
| 2014 | $2,439 | $85,974 | $10,720 | $75,254 |
Source: Public Records
Map
Nearby Homes
- 3810 Chulio Rd SE
- 375 Druid Rd SE
- 0 Powell Rd SE Unit 10606945
- 16 Unbridled Rd Unit 22
- 16 Unbridled Rd
- 0 Satcher Rd Unit 10626187
- 0 Satcher Rd Unit 7666911
- 0 Satcher Rd Unit 19425114
- 0 Satcher Rd Unit 4 19430080
- 0 Satcher Rd Unit 4 20170176
- 0 Satcher Rd Unit 1 20170093
- 00 Satcher Rd
- 344 Powell Rd SE
- 0 Hillindale Dr SE Unit 10515824
- 0 Hillindale Dr SE Unit 7574083
- 139 Shoals Ferry Rd SE
- 131 Hine Rd SE
- 7 Trimble Way SE
- 0 Lot #27 Hermitage Rd
- 1561 Pleasant Valley Rd SE
- 290 Biddy Rd SE
- 303 Biddy Rd SE
- 277 Biddy Rd SE
- 277 Biddy Rd SE
- 397 Biddy Rd SE
- 315 Biddy Rd SE Unit A
- 315 Biddy Rd SE Unit B
- 315 Biddy Rd SE
- 410 Biddy Rd SE
- 140 Biddy Rd SE
- 129 Biddy Rd SE
- 60 Biddy Rd SE
- 3085 Chulio Rd SE
- 216 Biddy Rd SE
- 91 Biddy Rd SE
- 91 Biddy Rd SE
- 3153 Chulio Rd SE
- 69 Biddy Rd SE
- 69 Biddy Rd SE
- 4215 Chulio Rd SE