Estimated Value: $125,000 - $164,000
3
Beds
1
Bath
957
Sq Ft
$146/Sq Ft
Est. Value
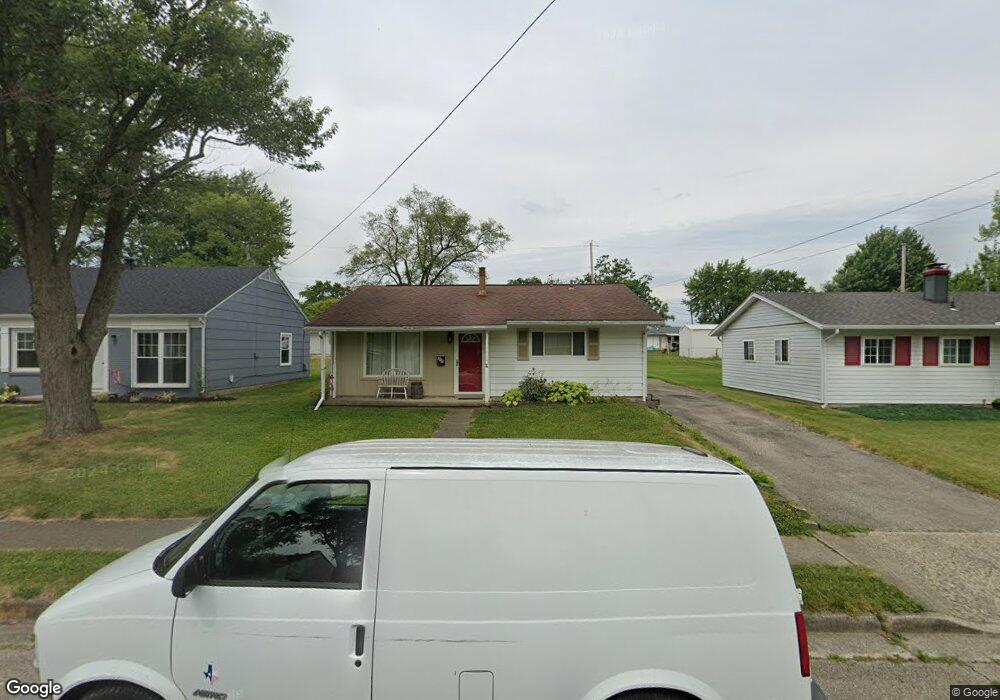
About This Home
This home is located at 320 Blaine Ave, Piqua, OH 45356 and is currently estimated at $139,715, approximately $145 per square foot. 320 Blaine Ave is a home located in Miami County with nearby schools including Piqua Junior High School, Piqua High School, and Nicholas School.
Ownership History
Date
Name
Owned For
Owner Type
Purchase Details
Closed on
Dec 14, 2017
Sold by
Peltier Jeffery L
Bought by
Peltier Jeffery L and Peltier Donna J
Current Estimated Value
Purchase Details
Closed on
Oct 15, 2004
Sold by
Household Realty Corp
Bought by
Peltier Jeffrey L
Home Financials for this Owner
Home Financials are based on the most recent Mortgage that was taken out on this home.
Original Mortgage
$47,700
Outstanding Balance
$23,813
Interest Rate
5.89%
Estimated Equity
$115,902
Purchase Details
Closed on
May 21, 2004
Sold by
Street Gregory S
Bought by
Household Realty Corp
Purchase Details
Closed on
Aug 2, 2002
Sold by
Street Greggory S
Bought by
Street Shoyn K and Street Greggory S
Purchase Details
Closed on
Jan 3, 1996
Sold by
Gambill Pearl
Bought by
Gregory S Street
Home Financials for this Owner
Home Financials are based on the most recent Mortgage that was taken out on this home.
Original Mortgage
$33,950
Interest Rate
7.41%
Mortgage Type
New Conventional
Purchase Details
Closed on
Sep 1, 1983
Bought by
Gambill Pearl
Create a Home Valuation Report for This Property
The Home Valuation Report is an in-depth analysis detailing your home's value as well as a comparison with similar homes in the area
Home Values in the Area
Average Home Value in this Area
Purchase History
| Date | Buyer | Sale Price | Title Company |
|---|---|---|---|
| Peltier Jeffery L | -- | -- | |
| Peltier Jeffrey L | $53,000 | -- | |
| Household Realty Corp | $43,000 | -- | |
| Street Shoyn K | -- | -- | |
| Gregory S Street | $35,000 | -- | |
| Gambill Pearl | $27,000 | -- |
Source: Public Records
Mortgage History
| Date | Status | Borrower | Loan Amount |
|---|---|---|---|
| Open | Street Shoyn K | $47,700 | |
| Previous Owner | Gregory S Street | $33,950 |
Source: Public Records
Tax History
| Year | Tax Paid | Tax Assessment Tax Assessment Total Assessment is a certain percentage of the fair market value that is determined by local assessors to be the total taxable value of land and additions on the property. | Land | Improvement |
|---|---|---|---|---|
| 2024 | $1,382 | $27,450 | $6,340 | $21,110 |
| 2023 | $1,157 | $27,450 | $6,340 | $21,110 |
| 2022 | $1,178 | $27,450 | $6,340 | $21,110 |
| 2021 | $951 | $20,340 | $4,690 | $15,650 |
| 2020 | $935 | $20,340 | $4,690 | $15,650 |
| 2019 | $940 | $20,340 | $4,690 | $15,650 |
| 2018 | $937 | $19,330 | $4,730 | $14,600 |
| 2017 | $923 | $19,330 | $4,730 | $14,600 |
| 2016 | $913 | $19,330 | $4,730 | $14,600 |
| 2015 | $898 | $18,590 | $4,550 | $14,040 |
| 2014 | $898 | $18,590 | $4,550 | $14,040 |
| 2013 | $901 | $18,590 | $4,550 | $14,040 |
Source: Public Records
Map
Nearby Homes
Your Personal Tour Guide
Ask me questions while you tour the home.