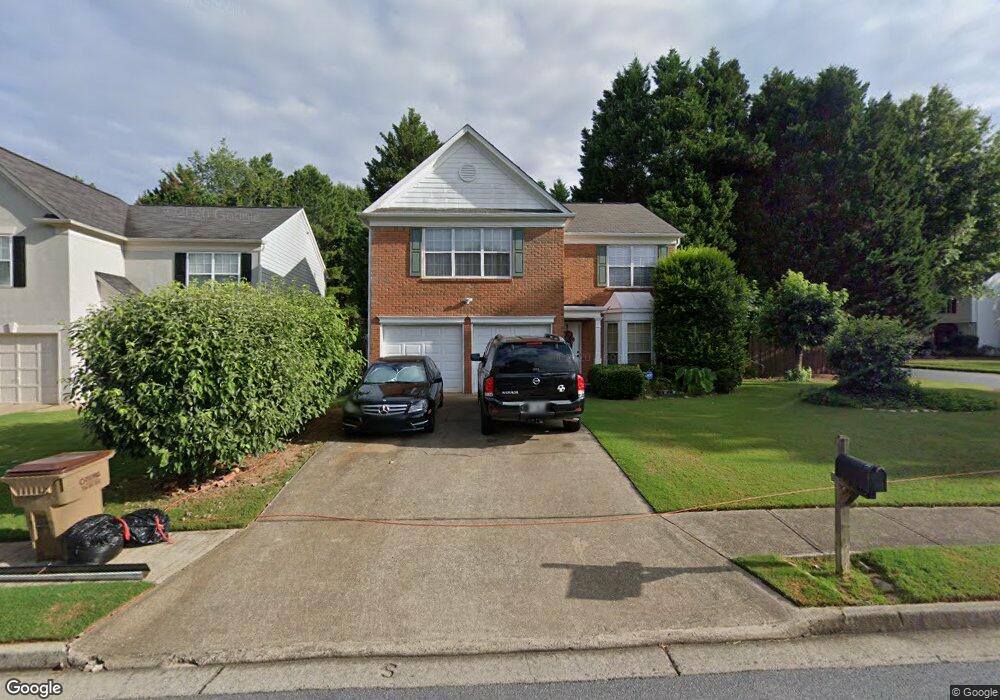
320 Bramford Way NW Kennesaw, GA 30144
Estimated Value: $360,000 - $395,454
3
Beds
3
Baths
1,796
Sq Ft
$213/Sq Ft
Est. Value
About This Home
This home is located at 320 Bramford Way NW, Kennesaw, GA 30144 and is currently estimated at $382,364, approximately $212 per square foot. 320 Bramford Way NW is a home located in Cobb County with nearby schools including Chalker Elementary School, Palmer Middle School, and Kell High School.
Ownership History
Date
Name
Owned For
Owner Type
Purchase Details
Closed on
Jun 27, 2006
Sold by
Hicks Michael K
Bought by
Dermendzhiev Cvetozar D and Dermendzhiev Diana
Current Estimated Value
Home Financials for this Owner
Home Financials are based on the most recent Mortgage that was taken out on this home.
Original Mortgage
$174,000
Outstanding Balance
$102,298
Interest Rate
6.57%
Mortgage Type
New Conventional
Estimated Equity
$280,066
Purchase Details
Closed on
Mar 6, 1998
Sold by
Singer Steven H
Bought by
Hicks Michael K
Home Financials for this Owner
Home Financials are based on the most recent Mortgage that was taken out on this home.
Original Mortgage
$114,450
Interest Rate
6.99%
Mortgage Type
New Conventional
Purchase Details
Closed on
Apr 26, 1995
Sold by
Pulte Home
Bought by
Singer Steven H
Create a Home Valuation Report for This Property
The Home Valuation Report is an in-depth analysis detailing your home's value as well as a comparison with similar homes in the area
Home Values in the Area
Average Home Value in this Area
Purchase History
| Date | Buyer | Sale Price | Title Company |
|---|---|---|---|
| Dermendzhiev Cvetozar D | $174,000 | -- | |
| Hicks Michael K | $120,500 | -- | |
| Singer Steven H | $118,200 | -- |
Source: Public Records
Mortgage History
| Date | Status | Borrower | Loan Amount |
|---|---|---|---|
| Open | Dermendzhiev Cvetozar D | $174,000 | |
| Previous Owner | Hicks Michael K | $114,450 | |
| Closed | Singer Steven H | $0 |
Source: Public Records
Tax History Compared to Growth
Tax History
| Year | Tax Paid | Tax Assessment Tax Assessment Total Assessment is a certain percentage of the fair market value that is determined by local assessors to be the total taxable value of land and additions on the property. | Land | Improvement |
|---|---|---|---|---|
| 2025 | $837 | $143,848 | $34,000 | $109,848 |
| 2024 | $3,343 | $143,848 | $34,000 | $109,848 |
| 2023 | $2,385 | $124,716 | $32,000 | $92,716 |
| 2022 | $2,169 | $89,004 | $20,000 | $69,004 |
| 2021 | $2,169 | $89,004 | $20,000 | $69,004 |
| 2020 | $2,128 | $87,112 | $18,000 | $69,112 |
| 2019 | $1,907 | $77,028 | $14,000 | $63,028 |
| 2018 | $1,907 | $77,028 | $14,000 | $63,028 |
| 2017 | $1,686 | $70,392 | $14,000 | $56,392 |
| 2016 | $1,472 | $60,600 | $14,000 | $46,600 |
| 2015 | $1,510 | $60,600 | $14,000 | $46,600 |
| 2014 | $1,201 | $49,248 | $0 | $0 |
Source: Public Records
Map
Nearby Homes
- 338 Bramford Way NW
- 4228 Pentworth Ln NW
- 4393 Laurian Dr NW
- 496 Bottesford Dr NW
- 412 Monroe Way NW Unit 2
- 4065 Maxanne Dr NW
- 95 Simpson Dr NE
- 4095 Maxanne Dr NW
- 4481 Dunmovin Dr NW
- 488 Fescue Ct
- 520 Fescue Ct
- 487 Fescue Ct
- 4356 Mikandy Dr NW
- 4699 N View Rd NW Unit 1
- 4699 N View Rd NW
- 400 Vinca Cir NW
- 4110 Oak Ferry Dr NE
- Venice Plan at The Reserve at Bells Ferry
- Naples Plan at The Reserve at Bells Ferry
- Milan Plan at The Reserve at Bells Ferry
- 322 Bramford Way NW
- 324 Bramford Way NW Unit 1
- 4249 Pentworth Ln NW
- 316 Bramford Way NW
- 4241 Pentworth Ln NW
- 4251 Pentworth Ln NW
- 326 Bramford Way NW
- 4248 Pentworth Ln NW
- 4246 Pentworth Ln NW
- 314 Bramford Way NW
- 4239 Pentworth Ln NW
- 328 Bramford Way NW
- 325 Bramford Way NW
- 315 Bramford Way NW
- 4253 Pentworth Ln NW
- 4250 Pentworth Ln NW Unit 1
- 327 Bramford Way NW
- 313 Bramford Way NW
- 4237 Pentworth Ln NW
- 330 Bramford Way NW