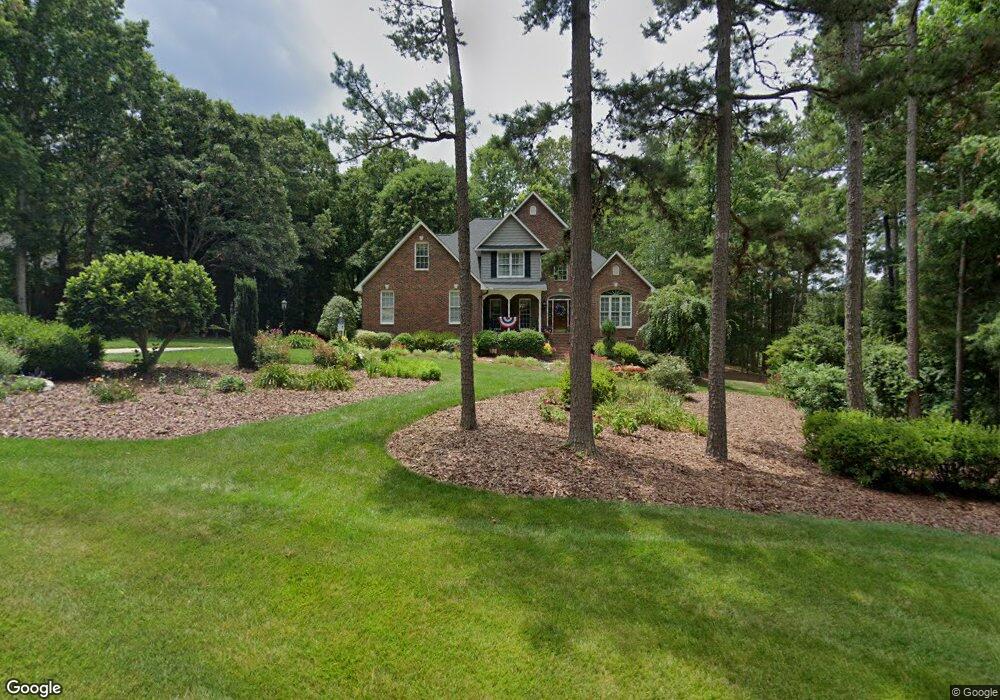
320 Brantley Dr Asheboro, NC 27205
Estimated Value: $458,535 - $569,000
--
Bed
3
Baths
2,763
Sq Ft
$184/Sq Ft
Est. Value
About This Home
This home is located at 320 Brantley Dr, Asheboro, NC 27205 and is currently estimated at $507,134, approximately $183 per square foot. 320 Brantley Dr is a home located in Randolph County with nearby schools including Sycamore Elementary School, Southmont Elementary School, and Southwestern Randolph Middle School.
Ownership History
Date
Name
Owned For
Owner Type
Purchase Details
Closed on
Mar 4, 2024
Sold by
Brady Thomas Lloyd and Brady Gail S
Bought by
Brady Family Revocable Trust and Brady
Current Estimated Value
Purchase Details
Closed on
Dec 9, 2021
Sold by
Samuel Lloyd And Dovie Brady Family Trus
Bought by
2 Aguilas Llc
Purchase Details
Closed on
Sep 29, 2005
Sold by
Brady Thomas Lloyd
Bought by
Brady Thomas Lloyd and Brady Gail S
Purchase Details
Closed on
Sep 28, 2005
Sold by
Brady Samuel Lloyd and Brady Dovie G
Bought by
Brady Thomas Lloyd
Purchase Details
Closed on
Sep 27, 2005
Sold by
Brady Samuel Lloyd and Brady Dovie G
Bought by
Brady Thomas Lloyd and Brady Gail S
Purchase Details
Closed on
Sep 26, 2005
Sold by
Brady Thomas Lloyd and Brady Gail S
Bought by
Brady Samuel Lloyd and Brady Dovie G
Purchase Details
Closed on
Feb 7, 1995
Bought by
Brady Thomas Lloyd Brady Gail S
Create a Home Valuation Report for This Property
The Home Valuation Report is an in-depth analysis detailing your home's value as well as a comparison with similar homes in the area
Home Values in the Area
Average Home Value in this Area
Purchase History
| Date | Buyer | Sale Price | Title Company |
|---|---|---|---|
| Brady Family Revocable Trust | -- | None Listed On Document | |
| 2 Aguilas Llc | $150,000 | None Listed On Document | |
| Brady Thomas Lloyd | -- | -- | |
| Brady Thomas Lloyd | -- | -- | |
| Brady Thomas Lloyd | $68,500 | -- | |
| Brady Samuel Lloyd | $111,500 | -- | |
| Brady Thomas Lloyd Brady Gail S | $12,500 | -- |
Source: Public Records
Tax History Compared to Growth
Tax History
| Year | Tax Paid | Tax Assessment Tax Assessment Total Assessment is a certain percentage of the fair market value that is determined by local assessors to be the total taxable value of land and additions on the property. | Land | Improvement |
|---|---|---|---|---|
| 2025 | $2,197 | $399,360 | $50,680 | $348,680 |
| 2024 | $2,197 | $399,360 | $50,680 | $348,680 |
| 2023 | $2,197 | $399,360 | $50,680 | $348,680 |
| 2022 | $1,832 | $288,440 | $30,400 | $258,040 |
| 2021 | $1,832 | $288,440 | $30,400 | $258,040 |
| 2020 | $1,759 | $288,440 | $30,400 | $258,040 |
| 2019 | $34 | $288,440 | $30,400 | $258,040 |
| 2018 | $1,714 | $275,870 | $31,320 | $244,550 |
| 2016 | $1,668 | $275,869 | $31,320 | $244,549 |
| 2015 | $1,674 | $275,869 | $31,320 | $244,549 |
| 2014 | -- | $275,869 | $31,320 | $244,549 |
Source: Public Records
Map
Nearby Homes
- 6015 Zoo Pkwy
- 6009 Zoo Pkwy
- 0 Lisbon Rd
- 3162 Montclair Ct
- 167 Drum St
- Promenade Plan at The Villas at Pinewood
- Portico Plan at The Villas at Pinewood
- Torino Plan at The Villas at Pinewood
- Wellington Plan at The Villas at Pinewood
- 0 Ross Harris
- 214 Vancroft St
- 708 Dawson Miller Rd
- 5979 US Highway 220 S
- 4149 Happy Hollow Rd
- 916 S Creek Ct
- 197 Copples Rd
- 4263 Zoo Pkwy
- 4240 Nc Highway 134
- 116 Bullins Ln
- 00 Route 220 Hwy
- 340 Brantley Dr
- 835 Greenview Dr
- 347 Brantley Dr
- 348 Brantley Dr
- 316 Walnut Dr
- 292 Walnut Dr
- 367 Brantley Dr
- 330 Walnut Dr
- 368 Brantley Dr
- 960 Greenview Dr
- 346 Walnut Dr
- 0 Greenview Dr
- 828 Greenview Dr
- 358 Walnut Dr
- 371 Brantley Dr
- 305 Walnut Dr
- 297 Walnut Dr
- 327 Walnut Dr
- 372 Brantley Dr
- 373 Brantley Dr