Estimated Value: $42,000 - $95,000
3
Beds
2
Baths
1,120
Sq Ft
$55/Sq Ft
Est. Value
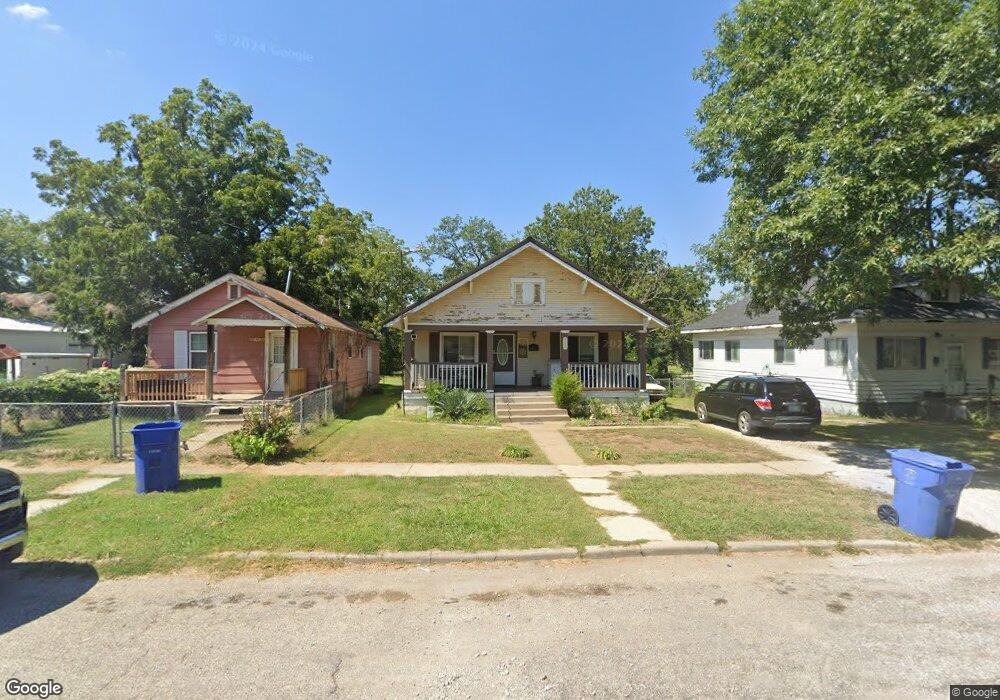
About This Home
This home is located at 320 C St SW, Miami, OK 74354 and is currently estimated at $61,781, approximately $55 per square foot. 320 C St SW is a home located in Ottawa County with nearby schools including Miami High School and Mt. Olive Lutheran School.
Ownership History
Date
Name
Owned For
Owner Type
Purchase Details
Closed on
Apr 1, 2021
Sold by
Heyburn John
Bought by
Parsons Grodon A and Parsons Gara D
Current Estimated Value
Home Financials for this Owner
Home Financials are based on the most recent Mortgage that was taken out on this home.
Original Mortgage
$31,000
Outstanding Balance
$27,929
Interest Rate
3%
Mortgage Type
Seller Take Back
Estimated Equity
$33,852
Purchase Details
Closed on
Apr 21, 2014
Bought by
Heyburn John
Purchase Details
Closed on
May 1, 2013
Sold by
Secretary Of Hud
Bought by
Downs Merle Todd and Downs Stephanie Dawn
Purchase Details
Closed on
Feb 14, 2002
Bought by
Hillestad John D
Create a Home Valuation Report for This Property
The Home Valuation Report is an in-depth analysis detailing your home's value as well as a comparison with similar homes in the area
Home Values in the Area
Average Home Value in this Area
Purchase History
| Date | Buyer | Sale Price | Title Company |
|---|---|---|---|
| Parsons Grodon A | $31,000 | None Available | |
| Heyburn John | $16,500 | -- | |
| Downs Merle Todd | -- | Heritage Title And Closing L | |
| Hillestad John D | $34,500 | -- |
Source: Public Records
Mortgage History
| Date | Status | Borrower | Loan Amount |
|---|---|---|---|
| Open | Parsons Grodon A | $31,000 |
Source: Public Records
Tax History Compared to Growth
Tax History
| Year | Tax Paid | Tax Assessment Tax Assessment Total Assessment is a certain percentage of the fair market value that is determined by local assessors to be the total taxable value of land and additions on the property. | Land | Improvement |
|---|---|---|---|---|
| 2025 | $244 | $3,364 | $368 | $2,996 |
| 2024 | $244 | $3,534 | $368 | $3,166 |
| 2023 | $244 | $3,534 | $342 | $3,192 |
| 2022 | $234 | $3,534 | $342 | $3,192 |
| 2021 | $238 | $2,521 | $341 | $2,180 |
| 2020 | $229 | $2,401 | $341 | $2,060 |
| 2019 | $188 | $2,287 | $341 | $1,946 |
| 2018 | $180 | $2,178 | $341 | $1,837 |
| 2017 | $174 | $2,074 | $341 | $1,733 |
| 2016 | $159 | $1,976 | $341 | $1,635 |
| 2015 | $349 | $3,933 | $310 | $3,623 |
| 2014 | $520 | $6,343 | $1,220 | $5,123 |
Source: Public Records
Map
Nearby Homes