4
Beds
2
Baths
1,620
Sq Ft
0.98
Acres
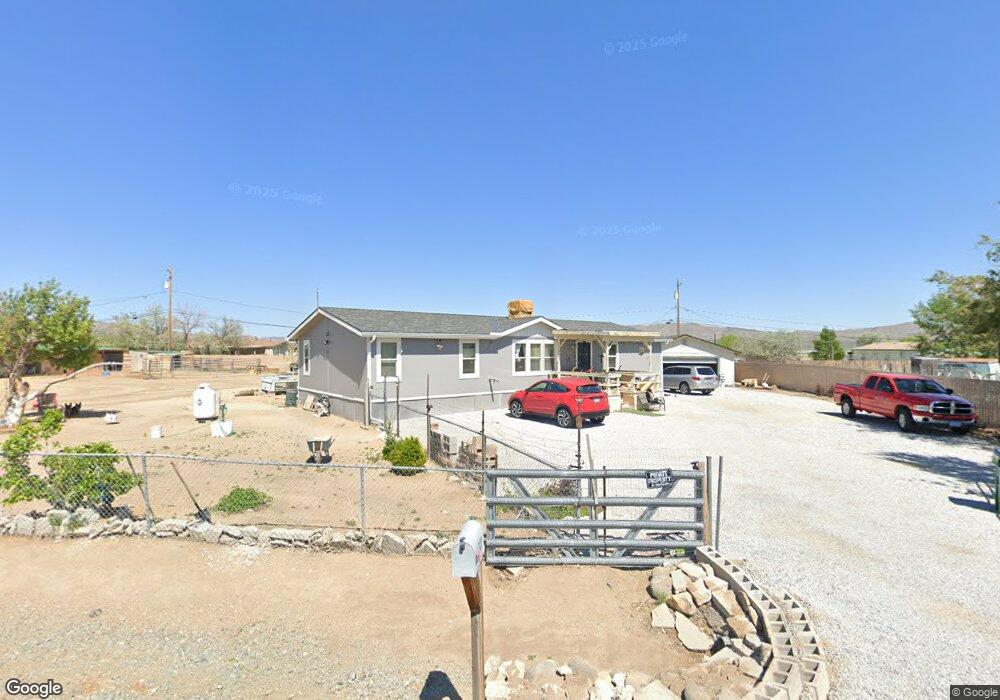
About This Home
This home is located at 320 Casey Ct, Reno, NV 89506. 320 Casey Ct is a home located in Washoe County with nearby schools including Lemmon Valley Elementary School, William O'Brien Middle School, and North Valleys High School.
Create a Home Valuation Report for This Property
The Home Valuation Report is an in-depth analysis detailing your home's value as well as a comparison with similar homes in the area
Home Values in the Area
Average Home Value in this Area
Tax History
| Year | Tax Paid | Tax Assessment Tax Assessment Total Assessment is a certain percentage of the fair market value that is determined by local assessors to be the total taxable value of land and additions on the property. | Land | Improvement |
|---|---|---|---|---|
| 2026 | $1,262 | $77,296 | $36,225 | $41,071 |
| 2025 | $1,563 | $75,370 | $33,950 | $41,420 |
| 2024 | $1,563 | $72,420 | $29,855 | $42,565 |
| 2023 | $1,448 | $65,837 | $26,775 | $39,062 |
| 2022 | $1,342 | $57,417 | $22,575 | $34,842 |
| 2021 | $1,244 | $51,561 | $19,250 | $32,311 |
| 2020 | $1,168 | $52,725 | $19,250 | $33,475 |
| 2019 | $1,113 | $52,207 | $19,250 | $32,957 |
| 2018 | $1,063 | $43,554 | $11,375 | $32,179 |
| 2017 | $1,019 | $43,803 | $10,325 | $33,478 |
| 2016 | $994 | $45,505 | $11,200 | $34,305 |
| 2015 | $987 | $35,962 | $6,720 | $29,242 |
| 2014 | $882 | $27,210 | $5,600 | $21,610 |
| 2013 | -- | $27,295 | $5,600 | $21,695 |
Source: Public Records
Map
Nearby Homes
- 12085 Albert Way
- 11605 Lemmon Dr
- 11600 Tupelo St
- 11590 Tupelo St
- 11567 Tupelo St
- 8510 Wicket Dr Unit Lot 45
- 8470 Endor Dr Unit Lot 15
- 8465 Endor Dr Unit Lot 87
- 11890 Chesapeake Dr
- 11890 Heartpine St
- 11595 Deodar Way
- 9021 Antelope Pass Dr
- 9015 Quail Grove Dr
- 8961 Buffalo Grove Dr
- 14430 Fredonia Dr
- 11960 Fir Dr
- 909 Convair Ct
- 11125 Gallaudet Dr
- 8960 Wolf River Dr
- 8905 Convair Way
- 12065 Albert Way
- 360 Casey Ct
- 305 Casey Ct
- 12025 Albert Way
- 12100 Salman Way
- 12205 Albert Way
- 310 Ramsey Way
- 405 Casey Ct
- 355 Pompe Way
- 375 Pompe Way
- 300 Ramsey Way
- 395 Pompe Way
- 12080 Salman Way
- 335 Pompe Way
- 285 Pompe Way
- 285 Pompe Way
- 445 Casey Ct
- 415 Pompe Way
- 12050 Albert Way Unit NV
- 12050 Albert Way