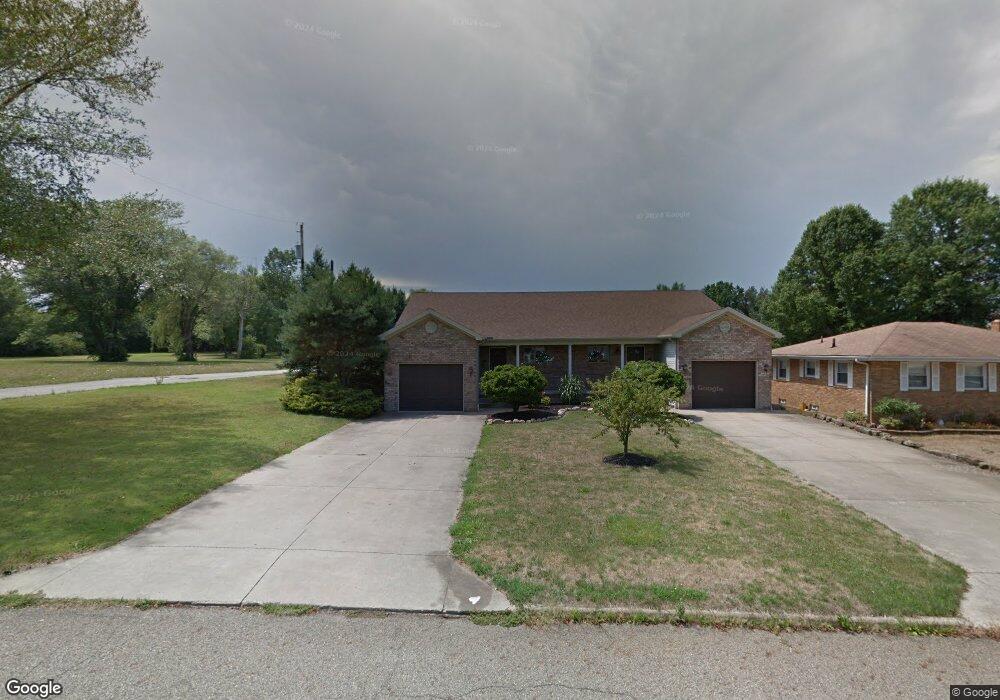
320 Center St Unit 322 Hubbard, OH 44425
Estimated Value: $177,000 - $256,542
4
Beds
2
Baths
2,195
Sq Ft
$98/Sq Ft
Est. Value
About This Home
This home is located at 320 Center St Unit 322, Hubbard, OH 44425 and is currently estimated at $215,886, approximately $98 per square foot. 320 Center St Unit 322 is a home located in Trumbull County with nearby schools including Hubbard Elementary School, Hubbard Middle School, and Hubbard High School.
Ownership History
Date
Name
Owned For
Owner Type
Purchase Details
Closed on
Jul 15, 2016
Sold by
Meixelberger Jamie R
Bought by
Johnson Lisa C
Current Estimated Value
Home Financials for this Owner
Home Financials are based on the most recent Mortgage that was taken out on this home.
Original Mortgage
$127,645
Outstanding Balance
$102,454
Interest Rate
3.75%
Mortgage Type
FHA
Estimated Equity
$113,432
Purchase Details
Closed on
Apr 9, 2009
Sold by
Bank Of America National Association
Bought by
Meixelberger Jaimie R
Home Financials for this Owner
Home Financials are based on the most recent Mortgage that was taken out on this home.
Original Mortgage
$114,880
Interest Rate
4.85%
Mortgage Type
FHA
Purchase Details
Closed on
Jan 12, 2009
Sold by
Garono Anthony L
Bought by
Lasalle Bank Na
Purchase Details
Closed on
Apr 29, 2003
Sold by
Garono Lawrence Patrick
Bought by
Garono Anthony L and Garono S
Purchase Details
Closed on
May 29, 2002
Sold by
Garono Ruth Ann
Bought by
Garono Lawrence Patrick
Create a Home Valuation Report for This Property
The Home Valuation Report is an in-depth analysis detailing your home's value as well as a comparison with similar homes in the area
Home Values in the Area
Average Home Value in this Area
Purchase History
| Date | Buyer | Sale Price | Title Company |
|---|---|---|---|
| Johnson Lisa C | $130,000 | None Available | |
| Meixelberger Jaimie R | $117,000 | Accutitle Agency Inc | |
| Lasalle Bank Na | $115,000 | None Available | |
| Garono Anthony L | -- | -- | |
| Garono Lawrence Patrick | -- | -- |
Source: Public Records
Mortgage History
| Date | Status | Borrower | Loan Amount |
|---|---|---|---|
| Open | Johnson Lisa C | $127,645 | |
| Previous Owner | Meixelberger Jaimie R | $114,880 |
Source: Public Records
Tax History Compared to Growth
Tax History
| Year | Tax Paid | Tax Assessment Tax Assessment Total Assessment is a certain percentage of the fair market value that is determined by local assessors to be the total taxable value of land and additions on the property. | Land | Improvement |
|---|---|---|---|---|
| 2024 | $3,427 | $68,540 | $6,900 | $61,640 |
| 2023 | $3,427 | $68,540 | $6,900 | $61,640 |
| 2022 | $2,902 | $52,860 | $6,340 | $46,520 |
| 2021 | $2,915 | $52,860 | $6,340 | $46,520 |
| 2020 | $2,929 | $52,860 | $6,340 | $46,520 |
| 2019 | $2,835 | $49,010 | $6,340 | $42,670 |
| 2018 | $2,825 | $49,010 | $6,340 | $42,670 |
| 2017 | $2,817 | $49,010 | $6,340 | $42,670 |
| 2016 | $2,503 | $46,210 | $6,340 | $39,870 |
| 2015 | $2,513 | $46,210 | $6,340 | $39,870 |
| 2014 | $2,457 | $46,210 | $6,340 | $39,870 |
| 2013 | $2,452 | $46,210 | $6,340 | $39,870 |
Source: Public Records
Map
Nearby Homes
- 312 W Park Ave
- 110 School St
- 124 Rebecca Ave
- 323 W Liberty St
- 160 Hager St
- 203 Hager St
- 191 Maple Leaf Dr
- 138 Moore St
- 28 Spring St
- 132 Drummond Ave
- 351 Elmwood Dr
- 239 Elmwood Dr
- 652 Meadowland Dr
- 6287 Youngstown Hubbard Rd
- 366 Westview Ave
- 381 Lauretta Ln
- 3234 Bell Wick Rd
- 1034 Doris Dr
- 6982 Mcclure Rd
- 3397 Pothour Wheeler Rd
- 348 Center St
- 138 Center St
- 332 Center St
- 316 Center St
- 360 Center St
- 335 Center St
- 365 Center St
- 139 Center St
- 341 Center St
- 374 Center St
- 373 Grace St
- 361 Center St
- 01-449258 Schotten Road (2 Acres Only)
- 370 Grace St
- 321 Center St
- 401 Grace St
- 375 Center St
- 404 Center St
- 228 Center St
- 374 Grace St