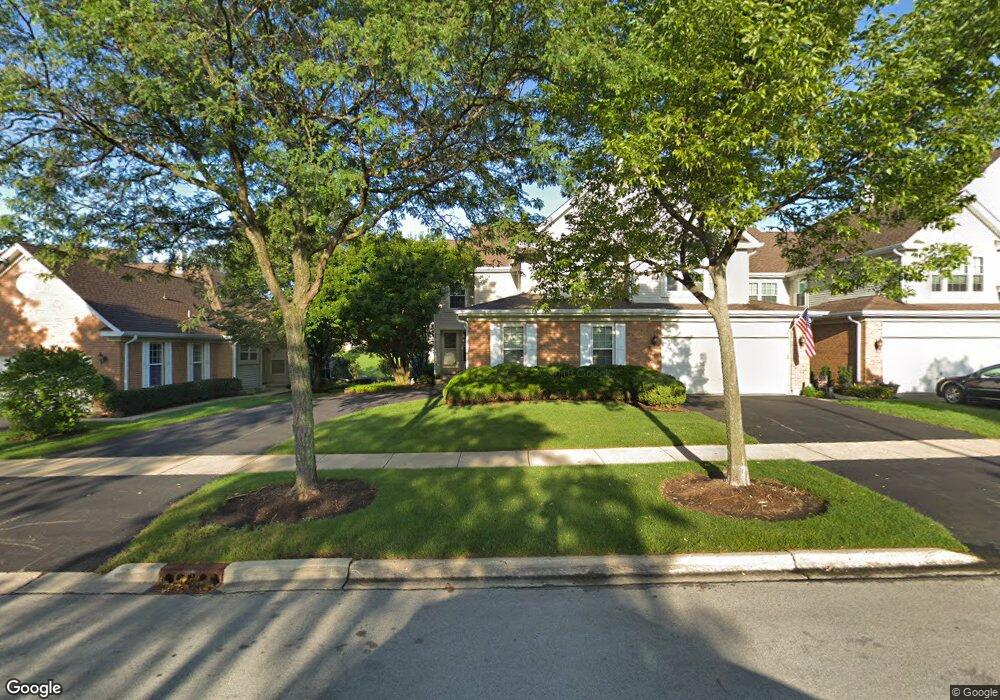
320 Cimarron Rd E Lombard, IL 60148
North Lombard NeighborhoodEstimated Value: $414,027 - $429,000
Studio
1
Bath
1,965
Sq Ft
$215/Sq Ft
Est. Value
About This Home
This home is located at 320 Cimarron Rd E, Lombard, IL 60148 and is currently estimated at $423,007, approximately $215 per square foot. 320 Cimarron Rd E is a home located in DuPage County with nearby schools including Forest Glen Elementary School, Hadley Junior High School, and Glenbard West High School.
Ownership History
Date
Name
Owned For
Owner Type
Purchase Details
Closed on
Aug 29, 2017
Sold by
Leone David A and David A Leone Revocable Living
Bought by
Leone David A and Leone Sharon R
Current Estimated Value
Purchase Details
Closed on
Sep 30, 2000
Sold by
Leone David A and Leone Sharon R
Bought by
Leone David A and David A Leone Revocable Living
Purchase Details
Closed on
Jan 26, 1996
Sold by
Vondersitt Richard J
Bought by
Leone David A and Leone Sharon R
Purchase Details
Closed on
Feb 1, 1995
Sold by
Vondersitt Richard J and Greenspan Joseph C
Bought by
Vondersitt Richard J
Home Financials for this Owner
Home Financials are based on the most recent Mortgage that was taken out on this home.
Original Mortgage
$50,000
Interest Rate
9.26%
Purchase Details
Closed on
Jan 4, 1994
Sold by
Suburban Trust & Svgs Bank
Bought by
Vondersitt Richard J and Greenspan Joseph C
Home Financials for this Owner
Home Financials are based on the most recent Mortgage that was taken out on this home.
Original Mortgage
$188,750
Interest Rate
4.87%
Create a Home Valuation Report for This Property
The Home Valuation Report is an in-depth analysis detailing your home's value as well as a comparison with similar homes in the area
Home Values in the Area
Average Home Value in this Area
Purchase History
| Date | Buyer | Sale Price | Title Company |
|---|---|---|---|
| Leone David A | -- | Attorney | |
| Leone David A | -- | -- | |
| Leone David A | $206,500 | -- | |
| Vondersitt Richard J | -- | -- | |
| Vondersitt Richard J | $196,000 | -- |
Source: Public Records
Mortgage History
| Date | Status | Borrower | Loan Amount |
|---|---|---|---|
| Previous Owner | Vondersitt Richard J | $50,000 | |
| Previous Owner | Vondersitt Richard J | $188,750 |
Source: Public Records
Tax History
| Year | Tax Paid | Tax Assessment Tax Assessment Total Assessment is a certain percentage of the fair market value that is determined by local assessors to be the total taxable value of land and additions on the property. | Land | Improvement |
|---|---|---|---|---|
| 2024 | $7,669 | $120,351 | $23,564 | $96,787 |
| 2023 | $7,277 | $110,780 | $21,690 | $89,090 |
| 2022 | $6,488 | $95,080 | $20,490 | $74,590 |
| 2021 | $6,221 | $92,820 | $20,000 | $72,820 |
| 2020 | $6,111 | $91,950 | $19,810 | $72,140 |
| 2019 | $5,944 | $89,530 | $19,290 | $70,240 |
| 2018 | $5,897 | $87,930 | $18,170 | $69,760 |
| 2017 | $5,778 | $84,690 | $17,500 | $67,190 |
| 2016 | $5,830 | $81,310 | $16,800 | $64,510 |
| 2015 | $5,626 | $77,570 | $16,030 | $61,540 |
| 2014 | $5,780 | $77,030 | $15,920 | $61,110 |
| 2013 | $5,621 | $77,260 | $15,970 | $61,290 |
Source: Public Records
Map
Nearby Homes
- 600 W Pleasant Ln Unit A3
- 440 W Meadow Ave
- 114 N Columbine Ave
- 236 N West Rd
- 247 N West Rd
- 711 N Columbine Ave
- 315 W Sunset Ave
- 65 S Glenview Ave
- 102 W Potomac Ave
- 410 Crescent Blvd Unit 2B
- 345 N Park Ave
- 147 W North Ave
- 324 N Charlotte St
- 1 S Lincoln Ave Unit 206
- 33 N Main St Unit 3C
- 31 E Grove St Unit 501
- LOT 2 Armitage Ave
- LOT 9 Armitage Ave
- 7 VACANT LOTS Armitage Ave
- 16 N Garfield St Unit 2E
- 322 Cimarron Rd E
- 324 Cimarron Rd E
- 318 Cimarron Rd E
- 326 Cimarron Rd E
- 316 Cimarron Rd E
- 617 Patrick Dr
- 623 Patricks Dr
- 314 Cimarron Rd E
- 619 Patrick Dr
- 312 Cimarron Rd E
- 621 Patrick Dr
- 310 Cimarron Rd E
- 319 Cimarron Rd E
- 323 Cimarron Rd E
- 321 Cimarron Rd E
- 317 Cimarron Rd E
- 623 Patrick Dr
- 315 Cimarron Rd E
- 327 Cimarron Rd E
- 317 Buckingham Ct