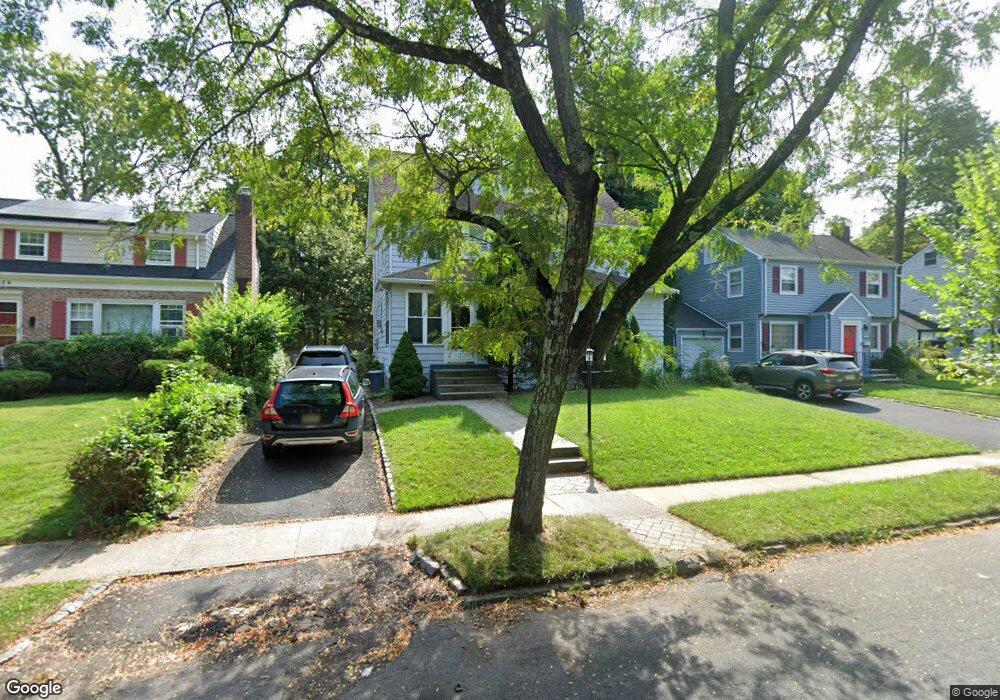
320 Clark St South Orange, NJ 07079
Estimated Value: $957,000 - $1,138,000
--
Bed
--
Bath
2,178
Sq Ft
$489/Sq Ft
Est. Value
About This Home
This home is located at 320 Clark St, South Orange, NJ 07079 and is currently estimated at $1,065,440, approximately $489 per square foot. 320 Clark St is a home located in Essex County with nearby schools including Marshall Elementary School, South Orange Middle School, and Columbia Senior High School.
Ownership History
Date
Name
Owned For
Owner Type
Purchase Details
Closed on
Apr 28, 2011
Sold by
Pringle Walter P
Bought by
Bourgerie Justin and Bourgerie Kristen
Current Estimated Value
Home Financials for this Owner
Home Financials are based on the most recent Mortgage that was taken out on this home.
Original Mortgage
$336,000
Outstanding Balance
$232,858
Interest Rate
4.82%
Mortgage Type
New Conventional
Estimated Equity
$832,582
Purchase Details
Closed on
Nov 17, 1997
Sold by
Parker Nicole
Bought by
Pringle Walter P
Home Financials for this Owner
Home Financials are based on the most recent Mortgage that was taken out on this home.
Original Mortgage
$157,600
Interest Rate
7.05%
Purchase Details
Closed on
May 31, 1994
Sold by
Santoliquido Joseph
Bought by
Parker Nicole and Parker Hudson
Home Financials for this Owner
Home Financials are based on the most recent Mortgage that was taken out on this home.
Original Mortgage
$180,000
Interest Rate
8.74%
Mortgage Type
VA
Create a Home Valuation Report for This Property
The Home Valuation Report is an in-depth analysis detailing your home's value as well as a comparison with similar homes in the area
Home Values in the Area
Average Home Value in this Area
Purchase History
| Date | Buyer | Sale Price | Title Company |
|---|---|---|---|
| Bourgerie Justin | $420,000 | None Available | |
| Pringle Walter P | $165,900 | -- | |
| Parker Nicole | $176,800 | -- |
Source: Public Records
Mortgage History
| Date | Status | Borrower | Loan Amount |
|---|---|---|---|
| Open | Bourgerie Justin | $336,000 | |
| Previous Owner | Pringle Walter P | $157,600 | |
| Previous Owner | Parker Nicole | $180,000 |
Source: Public Records
Tax History Compared to Growth
Tax History
| Year | Tax Paid | Tax Assessment Tax Assessment Total Assessment is a certain percentage of the fair market value that is determined by local assessors to be the total taxable value of land and additions on the property. | Land | Improvement |
|---|---|---|---|---|
| 2025 | $20,516 | $856,300 | $358,300 | $498,000 |
| 2024 | $20,516 | $856,300 | $358,300 | $498,000 |
| 2022 | $19,783 | $564,100 | $325,000 | $239,100 |
| 2021 | $19,095 | $564,100 | $325,000 | $239,100 |
| 2020 | $18,502 | $564,100 | $325,000 | $239,100 |
| 2019 | $18,040 | $564,100 | $325,000 | $239,100 |
| 2018 | $17,769 | $564,100 | $325,000 | $239,100 |
| 2017 | $17,329 | $564,100 | $325,000 | $239,100 |
| 2016 | $15,745 | $411,300 | $210,000 | $201,300 |
| 2015 | $15,379 | $411,300 | $210,000 | $201,300 |
| 2014 | $15,058 | $411,300 | $210,000 | $201,300 |
Source: Public Records
Map
Nearby Homes
- 409 Hillside Place
- 324 Scotland Rd
- 114 Irving Ave
- 423 N Ridgewood Rd
- 520 Scotland Rd
- 252 Raymond Ct
- 376 Melrose Place
- 390 Melrose Place
- 322 Beech Spring Rd
- 204 Raymond Ave
- 544 Hillside Terrace
- 525 Argyle Ave
- 290 N Wyoming Ave
- 488 Heywood Ave
- 403 Lawnridge Rd
- 403 Lawn Ridge Rd
- 669 Scotland Rd
- 669 Scotland Rd Unit 2
- 560 Berkeley Ave
- 668 Lincoln Ave
- 324 Clark St
- 316 Clark St
- 328 Clark St
- 312 Clark St
- 332 Clark St
- 317 Meeker St
- 321 Meeker St
- 315 Meeker St
- 71 Meadowbrook Place
- 325 Meeker St
- 311 Meeker St
- 63 Meadowbrook Place
- 59 Meadowbrook Place
- 336 Clark St
- 329 Meeker St
- 55 Meadowbrook Place
- 351 Meeker St
- 340 Clark St
- 51 Meadowbrook Place
- 322 Meadowbrook Ln