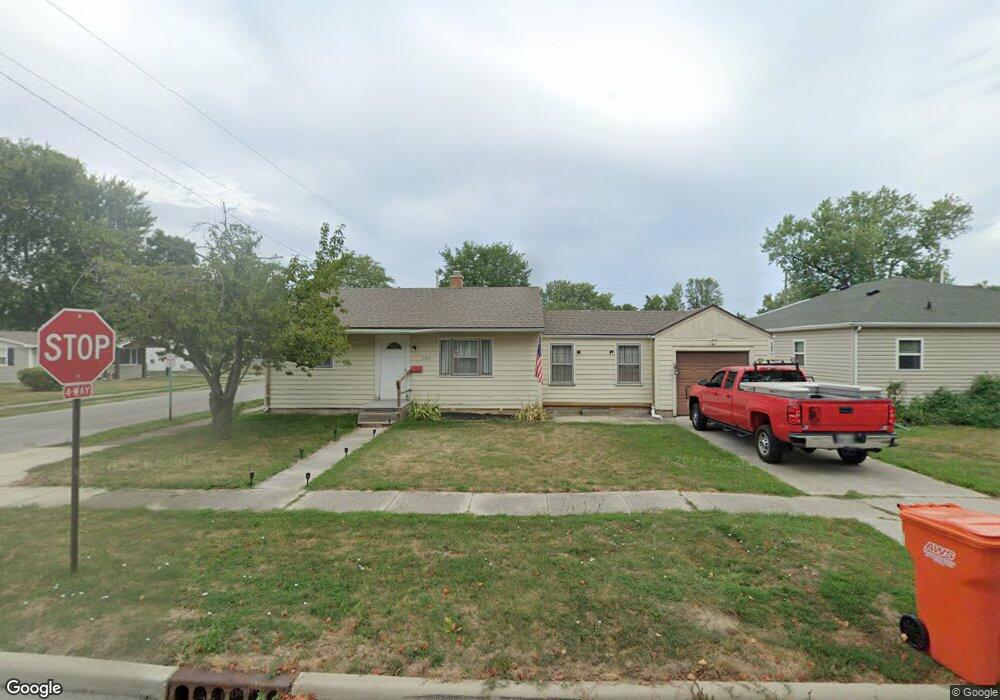
320 Clifton Ave Findlay, OH 45840
Estimated Value: $124,000 - $162,000
2
Beds
1
Bath
864
Sq Ft
$166/Sq Ft
Est. Value
About This Home
This home is located at 320 Clifton Ave, Findlay, OH 45840 and is currently estimated at $143,000, approximately $165 per square foot. 320 Clifton Ave is a home located in Hancock County with nearby schools including Northview Elementary School, Bigelow Hill Elementary School, and Glenwood Middle School.
Ownership History
Date
Name
Owned For
Owner Type
Purchase Details
Closed on
Jul 8, 2024
Sold by
Staschiak Rentals Llc
Bought by
Staschiak Rentals Ii Llc
Current Estimated Value
Purchase Details
Closed on
Nov 30, 2001
Sold by
Fifth Third Inv Co
Bought by
Staschiak Rentals Llc
Purchase Details
Closed on
Jun 20, 2001
Sold by
Harris Chad A
Bought by
Fifth Third Inv Co
Purchase Details
Closed on
Aug 16, 1996
Sold by
Hathaway Herbert
Bought by
Harris Chad and Fox Melissa
Home Financials for this Owner
Home Financials are based on the most recent Mortgage that was taken out on this home.
Original Mortgage
$56,000
Interest Rate
8.18%
Mortgage Type
New Conventional
Purchase Details
Closed on
Apr 4, 1994
Bought by
Hathaway Herbert L
Purchase Details
Closed on
Mar 4, 1986
Bought by
Harrold Bernard
Purchase Details
Closed on
Aug 15, 1983
Bought by
Harrold Bernard and Harrold Patricia
Create a Home Valuation Report for This Property
The Home Valuation Report is an in-depth analysis detailing your home's value as well as a comparison with similar homes in the area
Home Values in the Area
Average Home Value in this Area
Purchase History
| Date | Buyer | Sale Price | Title Company |
|---|---|---|---|
| Staschiak Rentals Ii Llc | -- | None Listed On Document | |
| Staschiak Rentals Llc | $50,000 | -- | |
| Fifth Third Inv Co | $40,000 | -- | |
| Harris Chad | $59,000 | -- | |
| Hathaway Herbert L | $51,500 | -- | |
| Harrold Bernard | -- | -- | |
| Harrold Bernard | $30,000 | -- |
Source: Public Records
Mortgage History
| Date | Status | Borrower | Loan Amount |
|---|---|---|---|
| Previous Owner | Harris Chad | $56,000 |
Source: Public Records
Tax History
| Year | Tax Paid | Tax Assessment Tax Assessment Total Assessment is a certain percentage of the fair market value that is determined by local assessors to be the total taxable value of land and additions on the property. | Land | Improvement |
|---|---|---|---|---|
| 2024 | $1,265 | $34,700 | $5,270 | $29,430 |
| 2023 | $1,267 | $34,700 | $5,270 | $29,430 |
| 2022 | $1,263 | $34,700 | $5,270 | $29,430 |
| 2021 | $1,201 | $28,750 | $5,270 | $23,480 |
| 2020 | $1,201 | $28,750 | $5,270 | $23,480 |
| 2019 | $1,177 | $28,750 | $5,270 | $23,480 |
| 2018 | $1,125 | $25,210 | $4,790 | $20,420 |
| 2017 | $1,126 | $25,210 | $4,790 | $20,420 |
| 2016 | $1,120 | $25,210 | $4,790 | $20,420 |
| 2015 | $964 | $21,430 | $4,790 | $16,640 |
| 2014 | $964 | $21,430 | $4,790 | $16,640 |
| 2012 | $972 | $21,430 | $4,790 | $16,640 |
Source: Public Records
Map
Nearby Homes
- 405 Clifton Ave
- 421 Clifton Ave
- 243 Monroe Ave
- 146 Clifton Ave
- 217 Prentiss Ave
- 528 Rector Ave
- 140 Monroe Ave
- 239 Edith Ave
- 315 W Melrose Ave
- 2318 Anna St
- 120 W Melrose Ave
- 701 W Melrose Ave
- 2419 Hollybrook Dr
- 724 Edith Ave
- 2400 Hollybrook Dr
- 705 Swing Ave
- 605 Davis St
- 400 Rosewood Ave
- 245 Edinborough Dr
- 719 Davis St
- 316 Clifton Ave
- 312 Clifton Ave
- 1804 Morey Ave
- 1800 Morey Ave
- 321 Rector Ave
- 1806 Morey Ave
- 319 Rector Ave
- 308 Clifton Ave
- 1808 Morey Ave
- 313 Rector Ave
- 408 Clifton Ave
- 311 Clifton Ave
- 1812 Morey Ave
- 309 Rector Ave
- 1724 Morey Ave
- 300 Clifton Ave
- 409 Rector Ave
- 412 Clifton Ave
- 303 Rector Ave
- 303 Clifton Ave
Your Personal Tour Guide
Ask me questions while you tour the home.