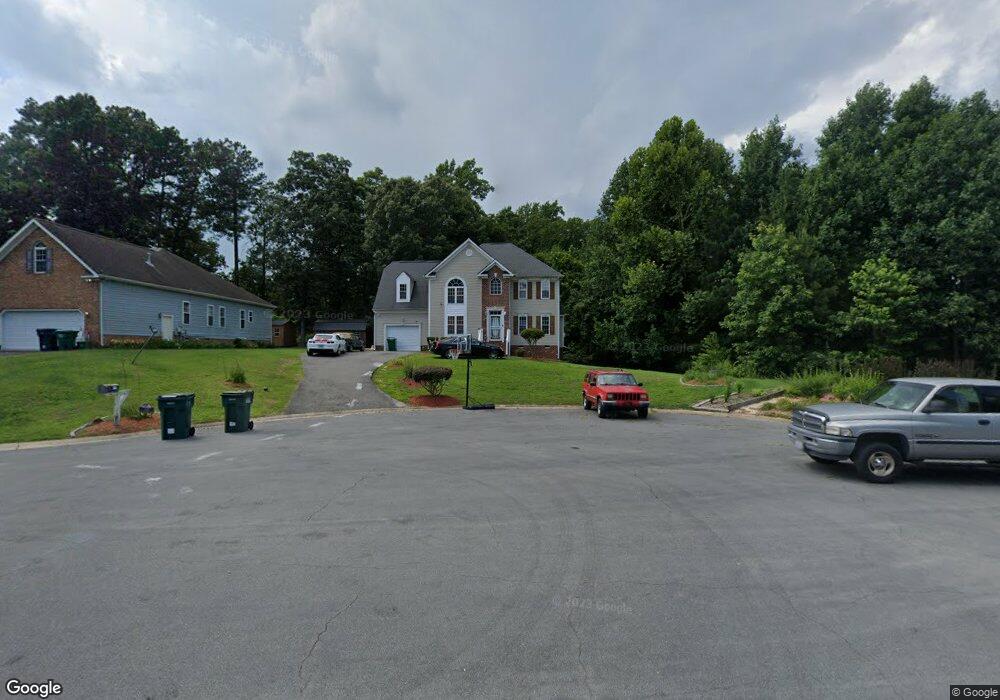
320 Confederate Run Ct Henrico, VA 23075
Estimated Value: $370,582 - $409,000
4
Beds
3
Baths
2,048
Sq Ft
$190/Sq Ft
Est. Value
About This Home
This home is located at 320 Confederate Run Ct, Henrico, VA 23075 and is currently estimated at $388,646, approximately $189 per square foot. 320 Confederate Run Ct is a home located in Henrico County with nearby schools including Donahoe Elementary School, Elko Middle School, and Highland Springs High School.
Ownership History
Date
Name
Owned For
Owner Type
Purchase Details
Closed on
Oct 6, 2011
Sold by
Deutsche Bank Nat Trust Co
Bought by
Morton Fred L
Current Estimated Value
Home Financials for this Owner
Home Financials are based on the most recent Mortgage that was taken out on this home.
Original Mortgage
$160,719
Interest Rate
4.25%
Mortgage Type
FHA
Purchase Details
Closed on
Apr 28, 2011
Sold by
Commonwealth Trustees Sub Tr
Bought by
Deutsche Bank Nat Trust Co
Purchase Details
Closed on
Nov 9, 2006
Sold by
H F Robbins Construction
Bought by
Crump Elton
Home Financials for this Owner
Home Financials are based on the most recent Mortgage that was taken out on this home.
Original Mortgage
$218,000
Interest Rate
6.31%
Mortgage Type
New Conventional
Purchase Details
Closed on
May 16, 2006
Sold by
Robbins H F
Bought by
H F Robbins Jr Construction
Create a Home Valuation Report for This Property
The Home Valuation Report is an in-depth analysis detailing your home's value as well as a comparison with similar homes in the area
Home Values in the Area
Average Home Value in this Area
Purchase History
| Date | Buyer | Sale Price | Title Company |
|---|---|---|---|
| Morton Fred L | $164,900 | -- | |
| Deutsche Bank Nat Trust Co | $140,000 | -- | |
| Crump Elton | $272,500 | -- | |
| H F Robbins Jr Construction | $45,000 | -- |
Source: Public Records
Mortgage History
| Date | Status | Borrower | Loan Amount |
|---|---|---|---|
| Previous Owner | Morton Fred L | $160,719 | |
| Previous Owner | Crump Elton | $218,000 |
Source: Public Records
Tax History Compared to Growth
Tax History
| Year | Tax Paid | Tax Assessment Tax Assessment Total Assessment is a certain percentage of the fair market value that is determined by local assessors to be the total taxable value of land and additions on the property. | Land | Improvement |
|---|---|---|---|---|
| 2025 | $2,897 | $319,200 | $60,000 | $259,200 |
| 2024 | $2,897 | $304,800 | $60,000 | $244,800 |
| 2023 | $2,621 | $304,800 | $60,000 | $244,800 |
| 2022 | $2,324 | $270,200 | $60,000 | $210,200 |
| 2021 | $2,267 | $242,700 | $58,000 | $184,700 |
| 2020 | $2,136 | $242,700 | $58,000 | $184,700 |
| 2019 | $1,930 | $219,300 | $58,000 | $161,300 |
| 2018 | $1,813 | $206,000 | $58,000 | $148,000 |
| 2017 | $1,813 | $206,000 | $58,000 | $148,000 |
| 2016 | $1,793 | $203,800 | $58,000 | $145,800 |
| 2015 | $1,793 | $203,800 | $58,000 | $145,800 |
| 2014 | $1,793 | $203,800 | $58,000 | $145,800 |
Source: Public Records
Map
Nearby Homes
- 300 Confederate Run Ct
- 304 Colonel Dr
- 312 Knight Ct
- 14 Beauregard Ave
- 307 N Lake Ave
- 208 N Beech Ave
- 5905 Polaria St
- 222 Robin Ave
- 104 N Beech Ave
- 9 Forest Ave
- 5906 3rd St
- 4 Forest Ave
- 16 N Elm Ave
- 13 S Beech Ave
- 202 N Grove Ave
- 120 N Grove Ave
- 402 N Ivy Ave
- 11, 13, 17 N Holly Ave
- 217 Liberty Ave
- 116 N Ivy Ave
- 316 Confederate Run Ct
- 324 Confederate Run Ct
- 312 Confederate Run Ct
- 328 Confederate Run Ct
- 307 Washington Ct
- 305 Washington Ct
- 329 Confederate Run Ct
- 325 Confederate Run Ct
- 308 Confederate Run Ct
- 321 Confederate Run Ct
- 317 Confederate Run Ct
- 311 Washington Ct
- 303 Washington Ct
- 304 Confederate Run Ct
- 305 Confederate Run Ct
- 865 Wales Dr
- 313 Confederate Run Ct
- 313 Washington Ct
- 301 Washington Ct
- 302 Washington Ct