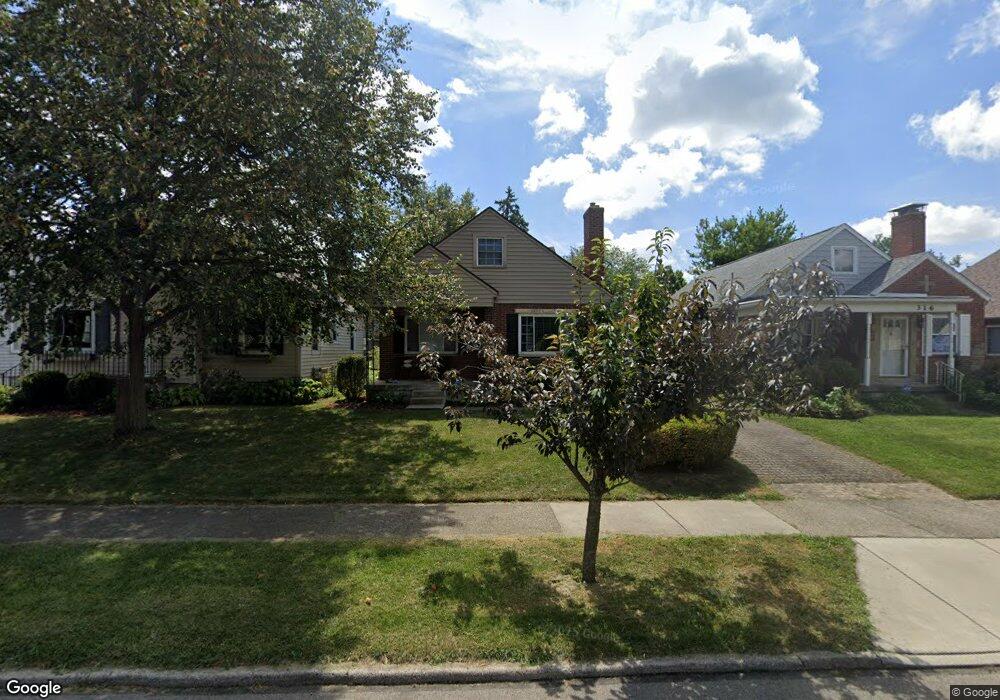
320 Cushing Ave Dayton, OH 45429
Estimated Value: $251,406 - $273,000
3
Beds
2
Baths
1,281
Sq Ft
$203/Sq Ft
Est. Value
About This Home
This home is located at 320 Cushing Ave, Dayton, OH 45429 and is currently estimated at $259,852, approximately $202 per square foot. 320 Cushing Ave is a home located in Montgomery County with nearby schools including Orchard Park Elementary School, Van Buren Middle School, and Kettering Fairmont High School.
Ownership History
Date
Name
Owned For
Owner Type
Purchase Details
Closed on
Oct 20, 2021
Sold by
Mcallister Brett K and Mcallister Jessie A
Bought by
Mccroskey Jeff and Mccroskey Maureen E
Current Estimated Value
Purchase Details
Closed on
Feb 16, 2011
Sold by
Schneider Nicole L and Sullivan Seamus M
Bought by
Mcallister Brett K and Mcallister Jessie A
Home Financials for this Owner
Home Financials are based on the most recent Mortgage that was taken out on this home.
Original Mortgage
$137,208
Interest Rate
4.75%
Mortgage Type
FHA
Purchase Details
Closed on
Jul 21, 2000
Sold by
Camden Patricia J
Bought by
Schneider Nicole L
Home Financials for this Owner
Home Financials are based on the most recent Mortgage that was taken out on this home.
Original Mortgage
$96,000
Interest Rate
8.27%
Purchase Details
Closed on
May 29, 1998
Sold by
Richard Russell James and Ann Cheryl
Bought by
Camden Patricia J
Home Financials for this Owner
Home Financials are based on the most recent Mortgage that was taken out on this home.
Original Mortgage
$114,980
Interest Rate
7.27%
Mortgage Type
FHA
Create a Home Valuation Report for This Property
The Home Valuation Report is an in-depth analysis detailing your home's value as well as a comparison with similar homes in the area
Home Values in the Area
Average Home Value in this Area
Purchase History
| Date | Buyer | Sale Price | Title Company |
|---|---|---|---|
| Mccroskey Jeff | $215,000 | Landmark Ttl Agcy South Inc | |
| Mcallister Brett K | $143,000 | Attorney | |
| Schneider Nicole L | $120,000 | -- | |
| Camden Patricia J | $115,900 | -- | |
| Camden Patricia J | $115,900 | -- |
Source: Public Records
Mortgage History
| Date | Status | Borrower | Loan Amount |
|---|---|---|---|
| Previous Owner | Mcallister Brett K | $137,208 | |
| Previous Owner | Schneider Nicole L | $96,000 | |
| Previous Owner | Camden Patricia J | $114,980 |
Source: Public Records
Tax History
| Year | Tax Paid | Tax Assessment Tax Assessment Total Assessment is a certain percentage of the fair market value that is determined by local assessors to be the total taxable value of land and additions on the property. | Land | Improvement |
|---|---|---|---|---|
| 2025 | $4,560 | $66,990 | $12,820 | $54,170 |
| 2024 | $4,438 | $66,990 | $12,820 | $54,170 |
| 2023 | $4,438 | $66,990 | $12,820 | $54,170 |
| 2022 | $3,918 | $46,160 | $8,840 | $37,320 |
| 2021 | $3,646 | $46,160 | $8,840 | $37,320 |
| 2020 | $3,658 | $46,160 | $8,840 | $37,320 |
| 2019 | $3,170 | $34,870 | $8,030 | $26,840 |
| 2018 | $2,912 | $34,870 | $8,030 | $26,840 |
| 2017 | $2,684 | $34,870 | $8,030 | $26,840 |
| 2016 | $2,609 | $31,830 | $8,030 | $23,800 |
| 2015 | $2,493 | $31,830 | $8,030 | $23,800 |
| 2014 | $2,493 | $31,830 | $8,030 | $23,800 |
| 2012 | -- | $45,500 | $8,030 | $37,470 |
Source: Public Records
Map
Nearby Homes
- 337 E Dorothy Ln
- 213 E Dorothy Ln
- 306 East Dr
- 320 Claranna Ave
- 29 East Dr
- 235 Claranna Ave
- 587 Cottingwood Ct
- 3102 Lenox Dr
- 639 Rockhill Ave
- 3487 Far Hills Ave
- 654 Cushing Ave
- 2721 Aerial Ave
- 319 Orchard Dr
- 305 Orchard Dr
- 567 Broad Blvd
- 326 N Bromfield Rd
- 110 Lincoln Park Blvd Unit 110
- 2704 Aerial Ave
- 448 Triangle Ave
- 2904 Roanoke Ave
- 324 Cushing Ave
- 316 Cushing Ave
- 328 Cushing Ave
- 312 Cushing Ave
- 332 Cushing Ave
- 308 Cushing Ave
- 321 Rockhill Ave
- 329 Rockhill Ave
- 317 Rockhill Ave
- 333 Rockhill Ave
- 336 Cushing Ave
- 313 Rockhill Ave
- 333 Cushing Ave
- 325 Cushing Ave
- 337 Rockhill Ave
- 337 Cushing Ave
- 321 Cushing Ave
- 309 Rockhill Ave
- 341 Rockhill Ave
- 340 Cushing Ave
Your Personal Tour Guide
Ask me questions while you tour the home.