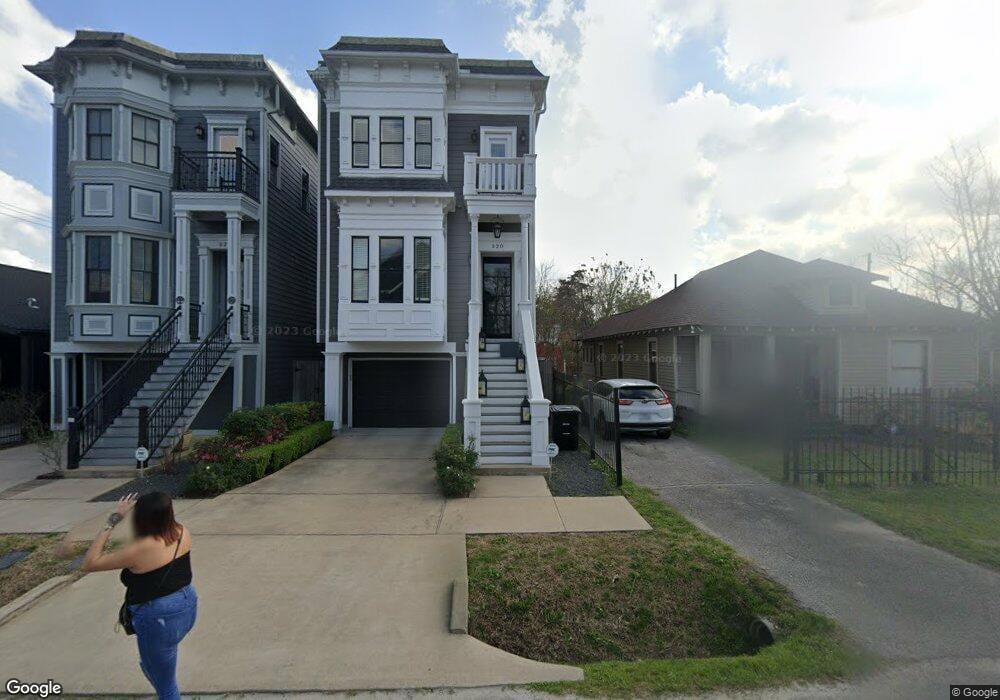
320 E 26th St Houston, TX 77008
Greater Heights NeighborhoodEstimated Value: $810,084 - $862,000
3
Beds
4
Baths
2,518
Sq Ft
$333/Sq Ft
Est. Value
About This Home
This home is located at 320 E 26th St, Houston, TX 77008 and is currently estimated at $837,771, approximately $332 per square foot. 320 E 26th St is a home with nearby schools including Helms Elementary School, Hamilton Middle, and Heights High School.
Ownership History
Date
Name
Owned For
Owner Type
Purchase Details
Closed on
Jul 26, 2021
Sold by
Gray John
Bought by
Pham Cindy Thy
Current Estimated Value
Home Financials for this Owner
Home Financials are based on the most recent Mortgage that was taken out on this home.
Original Mortgage
$505,000
Outstanding Balance
$455,440
Interest Rate
2.93%
Mortgage Type
New Conventional
Estimated Equity
$382,331
Purchase Details
Closed on
Apr 26, 2013
Sold by
Tbw Development Llc
Bought by
Gray John
Home Financials for this Owner
Home Financials are based on the most recent Mortgage that was taken out on this home.
Original Mortgage
$417,000
Interest Rate
3%
Mortgage Type
Adjustable Rate Mortgage/ARM
Purchase Details
Closed on
Jan 20, 2012
Sold by
Joe Ellen Kirby
Bought by
Tbw Development Llc
Purchase Details
Closed on
Jan 12, 2006
Sold by
Dahm Klara E
Bought by
Joe Ellen Kirby
Create a Home Valuation Report for This Property
The Home Valuation Report is an in-depth analysis detailing your home's value as well as a comparison with similar homes in the area
Home Values in the Area
Average Home Value in this Area
Purchase History
| Date | Buyer | Sale Price | Title Company |
|---|---|---|---|
| Pham Cindy Thy | -- | None Available | |
| Gray John | -- | Chicago Title | |
| Tbw Development Llc | -- | Chicago Title Insurance Co | |
| Joe Ellen Kirby | -- | None Available |
Source: Public Records
Mortgage History
| Date | Status | Borrower | Loan Amount |
|---|---|---|---|
| Open | Pham Cindy Thy | $505,000 | |
| Previous Owner | Gray John | $417,000 |
Source: Public Records
Tax History
| Year | Tax Paid | Tax Assessment Tax Assessment Total Assessment is a certain percentage of the fair market value that is determined by local assessors to be the total taxable value of land and additions on the property. | Land | Improvement |
|---|---|---|---|---|
| 2025 | $11,597 | $758,000 | $240,000 | $518,000 |
| 2024 | $11,597 | $743,413 | $210,000 | $533,413 |
| 2023 | $11,597 | $774,416 | $210,000 | $564,416 |
| 2022 | $14,312 | $650,000 | $180,000 | $470,000 |
| 2021 | $15,681 | $672,807 | $180,000 | $492,807 |
| 2020 | $16,730 | $690,858 | $180,000 | $510,858 |
| 2019 | $15,924 | $629,296 | $150,000 | $479,296 |
| 2018 | $12,501 | $629,296 | $135,000 | $494,296 |
| 2017 | $16,569 | $707,216 | $156,000 | $551,216 |
| 2016 | $15,062 | $791,880 | $234,000 | $557,880 |
| 2015 | $9,739 | $767,044 | $202,500 | $564,544 |
Source: Public Records
Map
Nearby Homes
- 322 E 26th St
- 324 E 26th St
- 324 E 26th St
- 316 E 26th St
- 314 E 26th St
- 327 Aurora St
- 327 N Aurora St
- 331 Aurora St
- 319 Aurora St
- 402 E 26th St
- 406 E 26th St
- 325 Aurora St
- 331 E 26th St
- 315 E 26th St
- 312 E 26th St
- 401 Aurora St
- 401 1 2 Aurora St
- 401 1/2 Aurora St Unit A
- 401 1/2 Aurora St
- 313 E 26th St
Your Personal Tour Guide
Ask me questions while you tour the home.