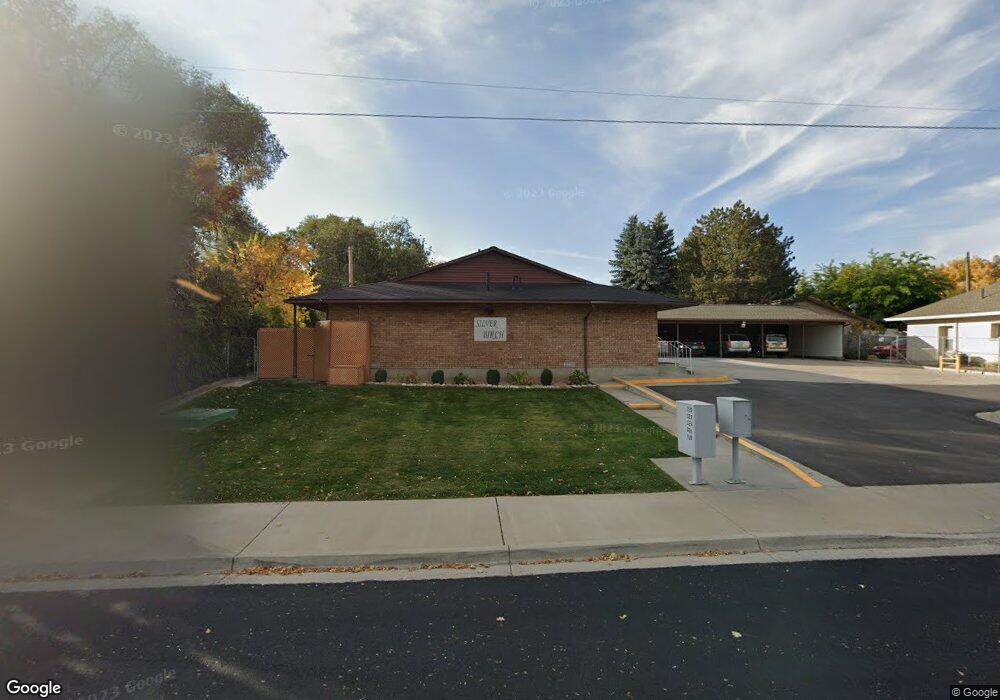
320 E 300 S Payson, UT 84651
Estimated Value: $252,000 - $263,524
2
Beds
1
Bath
984
Sq Ft
$263/Sq Ft
Est. Value
About This Home
This home is located at 320 E 300 S, Payson, UT 84651 and is currently estimated at $259,175, approximately $263 per square foot. 320 E 300 S is a home located in Utah County with nearby schools including Park View Elementary, Payson Junior High School, and Payson High School.
Ownership History
Date
Name
Owned For
Owner Type
Purchase Details
Closed on
Jun 29, 2023
Sold by
Tucker Tommy
Bought by
Miller Family Trust and Miller
Current Estimated Value
Purchase Details
Closed on
Nov 16, 2017
Sold by
Whitlock George Ross
Bought by
Tucker Tommy
Purchase Details
Closed on
Feb 21, 2013
Sold by
Ball Claric M
Bought by
Whitlock George Ross
Home Financials for this Owner
Home Financials are based on the most recent Mortgage that was taken out on this home.
Original Mortgage
$81,720
Interest Rate
3.36%
Mortgage Type
VA
Create a Home Valuation Report for This Property
The Home Valuation Report is an in-depth analysis detailing your home's value as well as a comparison with similar homes in the area
Home Values in the Area
Average Home Value in this Area
Purchase History
| Date | Buyer | Sale Price | Title Company |
|---|---|---|---|
| Miller Family Trust | -- | Cottonwood Title Insurance Age | |
| Tucker Tommy | -- | North American Title | |
| Whitlock George Ross | -- | Keystone Title Insurance Age |
Source: Public Records
Mortgage History
| Date | Status | Borrower | Loan Amount |
|---|---|---|---|
| Previous Owner | Whitlock George Ross | $81,720 |
Source: Public Records
Tax History
| Year | Tax Paid | Tax Assessment Tax Assessment Total Assessment is a certain percentage of the fair market value that is determined by local assessors to be the total taxable value of land and additions on the property. | Land | Improvement |
|---|---|---|---|---|
| 2025 | $1,205 | $134,585 | -- | -- |
| 2024 | $1,205 | $122,595 | $0 | $0 |
| 2023 | $1,350 | $137,775 | $0 | $0 |
| 2022 | $1,158 | $116,270 | $0 | $0 |
| 2021 | $966 | $155,500 | $18,700 | $136,800 |
| 2020 | $940 | $148,100 | $17,800 | $130,300 |
| 2019 | $873 | $141,000 | $20,000 | $121,000 |
| 2018 | $810 | $126,000 | $20,000 | $106,000 |
| 2017 | $690 | $57,750 | $0 | $0 |
| 2016 | $605 | $50,325 | $0 | $0 |
| 2015 | $586 | $48,400 | $0 | $0 |
| 2014 | $562 | $46,750 | $0 | $0 |
Source: Public Records
Map
Nearby Homes
Your Personal Tour Guide
Ask me questions while you tour the home.