Estimated Value: $586,000 - $790,000
3
Beds
2
Baths
2,230
Sq Ft
$321/Sq Ft
Est. Value
About This Home
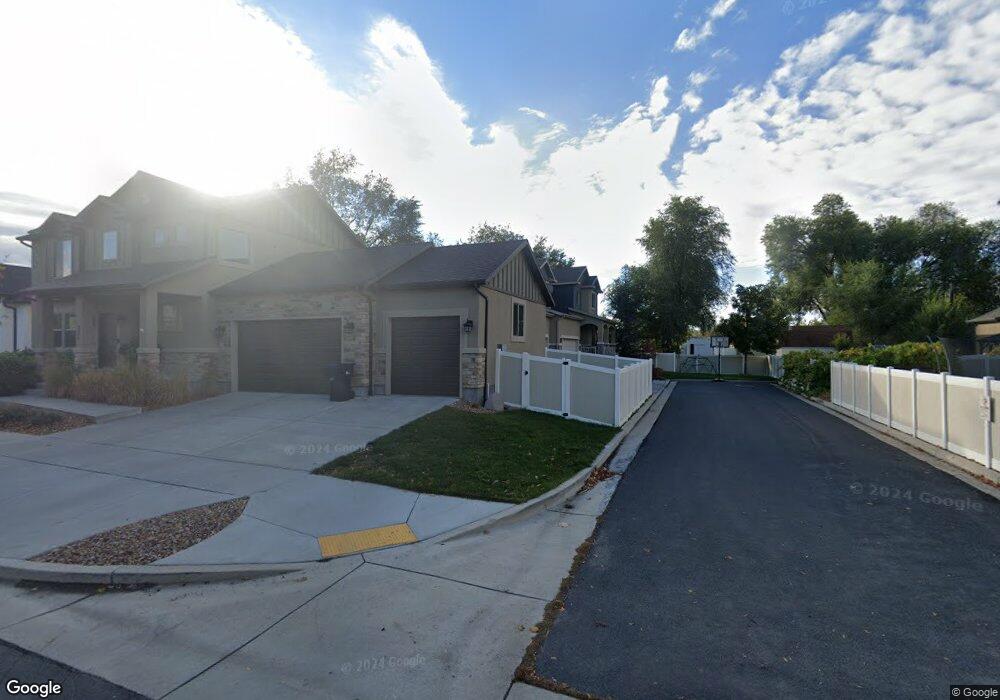
This home is located at 320 E 8620 S, Sandy, UT 84070 and is currently estimated at $716,329, approximately $321 per square foot. 320 E 8620 S is a home with nearby schools including Sandy Elementary School, Mount Jordan Middle School, and Jordan High.
Ownership History
Date
Name
Owned For
Owner Type
Purchase Details
Closed on
Dec 12, 2025
Sold by
Banded Properties Llc
Bought by
Haddock Jeremy and Haddock Martha
Current Estimated Value
Purchase Details
Closed on
Feb 13, 2024
Sold by
Haddock Jeremy and Haddock Martha
Bought by
Banded Properties Llc
Home Financials for this Owner
Home Financials are based on the most recent Mortgage that was taken out on this home.
Original Mortgage
$85,110
Interest Rate
10%
Mortgage Type
New Conventional
Purchase Details
Closed on
Mar 14, 2014
Sold by
Hogge Larry
Bought by
Haddock Jeremy and Haddock Martha
Home Financials for this Owner
Home Financials are based on the most recent Mortgage that was taken out on this home.
Original Mortgage
$277,762
Interest Rate
4.29%
Mortgage Type
New Conventional
Create a Home Valuation Report for This Property
The Home Valuation Report is an in-depth analysis detailing your home's value as well as a comparison with similar homes in the area
Home Values in the Area
Average Home Value in this Area
Purchase History
| Date | Buyer | Sale Price | Title Company |
|---|---|---|---|
| Haddock Jeremy | -- | Accommodation/Courtesy Recordi | |
| Banded Properties Llc | -- | Real Advantage Title Insurance | |
| Haddock Jeremy | -- | Gt Title Services Slc |
Source: Public Records
Mortgage History
| Date | Status | Borrower | Loan Amount |
|---|---|---|---|
| Previous Owner | Banded Properties Llc | $85,110 | |
| Previous Owner | Haddock Jeremy | $277,762 |
Source: Public Records
Tax History
| Year | Tax Paid | Tax Assessment Tax Assessment Total Assessment is a certain percentage of the fair market value that is determined by local assessors to be the total taxable value of land and additions on the property. | Land | Improvement |
|---|---|---|---|---|
| 2025 | $3,677 | $678,200 | $160,100 | $518,100 |
| 2024 | $3,677 | $680,100 | $149,700 | $530,400 |
| 2023 | $3,424 | $631,300 | $142,300 | $489,000 |
| 2022 | $3,652 | $657,800 | $139,500 | $518,300 |
| 2021 | $3,396 | $520,700 | $119,300 | $401,400 |
| 2020 | $3,268 | $472,600 | $119,300 | $353,300 |
| 2019 | $3,123 | $440,000 | $112,500 | $327,500 |
| 2018 | $2,746 | $402,800 | $112,500 | $290,300 |
| 2017 | $2,691 | $377,200 | $112,500 | $264,700 |
| 2016 | $2,771 | $375,400 | $112,500 | $262,900 |
| 2015 | $2,902 | $363,800 | $109,100 | $254,700 |
| 2014 | $1,785 | $219,400 | $100,100 | $119,300 |
Source: Public Records
Map
Nearby Homes
- 270 E 8680 S
- 412 E 8760 S
- 220 E Pioneer Ave
- 8459 S 300 E
- 194 Pioneer Ave
- 8558 S Center St
- 227 E St Germain Way
- 149 E Pioneer Ave
- 359 E 8400 S
- 8732 S 620 E
- 627 E 8680 S
- 87 Pioneer Ave
- 635 Pioneer Ave
- 8470 Solar Way
- 8322 S Levine Ln Unit 111
- 8953 S 90 E
- 144 E Chambord Ct
- 140 E Chambord Ct
- 138 E Chambord Ct
- 8915 S 660 E Unit 103
Your Personal Tour Guide
Ask me questions while you tour the home.