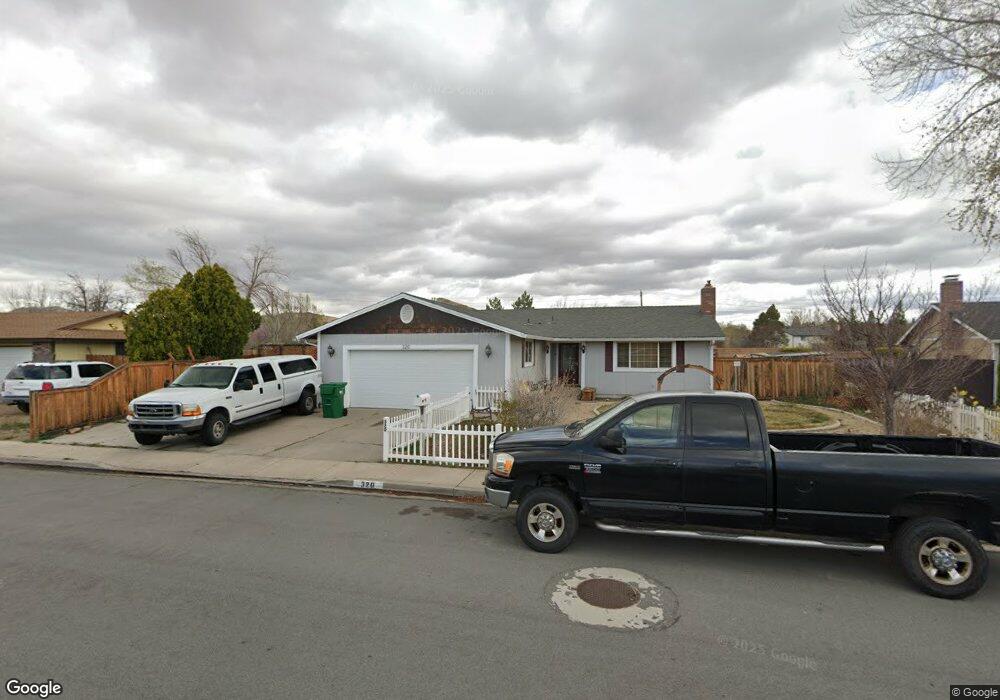
320 E Gault Way Sparks, NV 89431
McCarran Boulevard-Probasco NeighborhoodEstimated Value: $432,701 - $457,000
3
Beds
2
Baths
1,420
Sq Ft
$313/Sq Ft
Est. Value
About This Home
This home is located at 320 E Gault Way, Sparks, NV 89431 and is currently estimated at $444,425, approximately $312 per square foot. 320 E Gault Way is a home located in Washoe County with nearby schools including Florence Drake Elementary School, George L Dilworth Middle School, and Sparks High School.
Ownership History
Date
Name
Owned For
Owner Type
Purchase Details
Closed on
Jan 9, 2024
Sold by
Glenda M Fleming Trust
Bought by
Bell Jeremiah Randall
Current Estimated Value
Purchase Details
Closed on
Dec 12, 2023
Sold by
Glenda M Fleming Trust
Bought by
Bell Jeremiah Randall
Purchase Details
Closed on
Oct 5, 2020
Sold by
Stephanie Marquez-Guerrero
Bought by
Marquez-Guerrero Stephanie
Purchase Details
Closed on
Jan 24, 2018
Sold by
Fleming Glenda M
Bought by
Fleming Glenda M and The Glenda M Fleming Trust
Purchase Details
Closed on
Mar 16, 2001
Sold by
Franks Donald E and Franks Jenette I
Bought by
Fleming Glenda M
Home Financials for this Owner
Home Financials are based on the most recent Mortgage that was taken out on this home.
Original Mortgage
$100,000
Interest Rate
6.97%
Create a Home Valuation Report for This Property
The Home Valuation Report is an in-depth analysis detailing your home's value as well as a comparison with similar homes in the area
Home Values in the Area
Average Home Value in this Area
Purchase History
| Date | Buyer | Sale Price | Title Company |
|---|---|---|---|
| Bell Jeremiah Randall | -- | None Listed On Document | |
| Bell Jeremiah Randall | -- | None Listed On Document | |
| Marquez-Guerrero Stephanie | -- | Servicelink | |
| Fleming Glenda M | -- | None Available | |
| Fleming Glenda M | $136,500 | Western Title Inc |
Source: Public Records
Mortgage History
| Date | Status | Borrower | Loan Amount |
|---|---|---|---|
| Previous Owner | Fleming Glenda M | $100,000 |
Source: Public Records
Tax History Compared to Growth
Tax History
| Year | Tax Paid | Tax Assessment Tax Assessment Total Assessment is a certain percentage of the fair market value that is determined by local assessors to be the total taxable value of land and additions on the property. | Land | Improvement |
|---|---|---|---|---|
| 2025 | $1,635 | $63,512 | $33,044 | $30,468 |
| 2024 | $1,635 | $62,631 | $31,280 | $31,352 |
| 2023 | $1,515 | $61,702 | $31,437 | $30,265 |
| 2022 | $1,473 | $51,254 | $25,610 | $25,644 |
| 2021 | $1,430 | $43,624 | $17,672 | $25,952 |
| 2020 | $1,386 | $42,485 | $16,065 | $26,420 |
| 2019 | $1,346 | $42,614 | $16,853 | $25,761 |
| 2018 | $1,307 | $37,766 | $12,191 | $25,575 |
| 2017 | $1,271 | $36,825 | $10,868 | $25,957 |
| 2016 | $1,237 | $37,226 | $10,395 | $26,831 |
| 2015 | $1,235 | $35,579 | $8,474 | $27,105 |
| 2014 | $1,200 | $33,621 | $7,182 | $26,439 |
| 2013 | -- | $32,027 | $5,686 | $26,341 |
Source: Public Records
Map
Nearby Homes
- 3071 Meadowlands Dr
- 3104 Sandy St
- 120 E Lenwood Dr
- 3167 Bristle Branch Dr
- 745 Glen Vista Dr
- 3188 Bristle Branch Dr
- 3198 Bristle Branch Dr
- 3200 Bristle Branch Dr
- 10 Sheridan Way
- 3245 Elaine Way
- 119 Devere Way
- 930 Spanish Springs Rd
- 913 Glen Molly Dr
- 1095 E York Way
- 3595 Rocky Ridge Ct
- 1128 Bradley Square
- 1051 Glen Martin Dr
- 1973 Rio Tinto Dr
- 8 E O St
- 1029 Baywood Dr Unit D
- 340 E Gault Way
- 300 E Gault Way
- 360 E Gault Way
- 280 E Gault Way
- 345 E Gault Way
- 2965 Patrice Dr
- 390 E Gault Way Unit 2
- 2840 Patrice Dr
- 365 E Gault Way
- 260 E Gault Way
- 3069 Meadowlands Dr
- 3073 Meadowlands Dr
- 2885 Patrice Dr
- 3067 Meadowlands Dr
- 410 E Gault Way Unit 2
- 3075 Meadowlands Dr
- 2790 Patrice Dr
- 3065 Meadowlands Dr
- 2835 Patrice Dr
- 2755 Tallman Rd