Estimated Value: $217,000 - $244,000
3
Beds
2
Baths
1,353
Sq Ft
$168/Sq Ft
Est. Value
About This Home
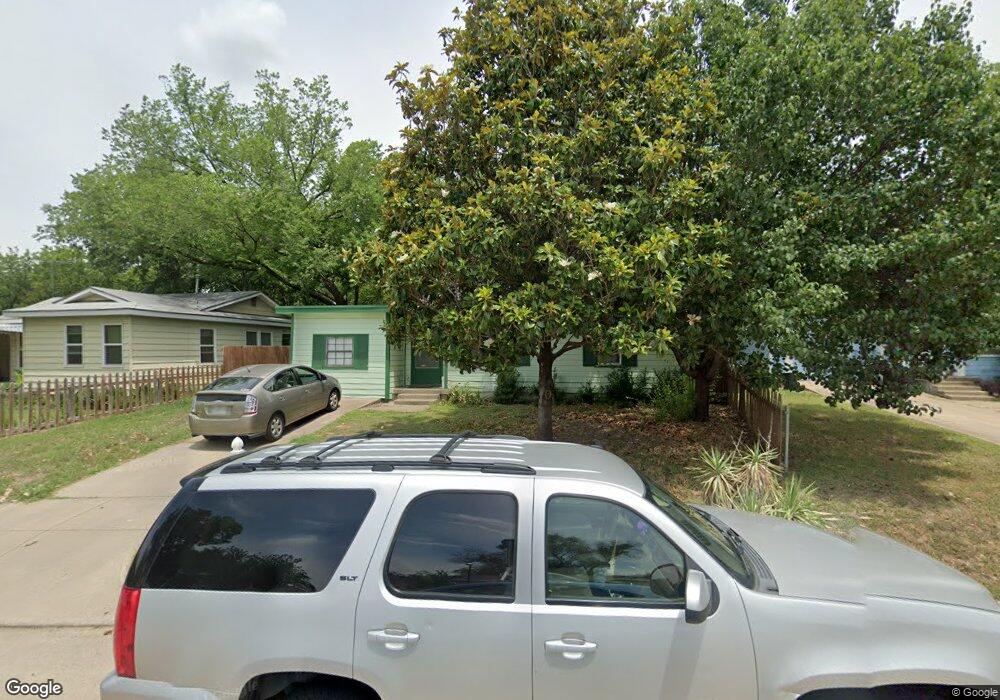
This home is located at 320 Elm St, Hurst, TX 76053 and is currently estimated at $227,897, approximately $168 per square foot. 320 Elm St is a home located in Tarrant County with nearby schools including Harrison Lane Elementary School, Hurst J High School, and L.D. Bell High School.
Ownership History
Date
Name
Owned For
Owner Type
Purchase Details
Closed on
Jan 23, 2024
Sold by
Ehmann Patrick Norbert and Ehmann Jancy W
Bought by
Patrick And Jancy Ehmann Family Trust and Ehmann
Current Estimated Value
Purchase Details
Closed on
Oct 4, 2019
Sold by
Ehmann Patrick Norbert
Bought by
Ehmann Patrick Norbert and Ehmann Jancy
Purchase Details
Closed on
Jun 22, 2001
Sold by
J Rags Properties Inc
Bought by
Silvey Jack
Home Financials for this Owner
Home Financials are based on the most recent Mortgage that was taken out on this home.
Original Mortgage
$75,318
Interest Rate
7.11%
Mortgage Type
FHA
Purchase Details
Closed on
Dec 31, 1999
Sold by
Heath Larry C
Bought by
Ragland James D
Home Financials for this Owner
Home Financials are based on the most recent Mortgage that was taken out on this home.
Original Mortgage
$40,950
Interest Rate
7.84%
Create a Home Valuation Report for This Property
The Home Valuation Report is an in-depth analysis detailing your home's value as well as a comparison with similar homes in the area
Home Values in the Area
Average Home Value in this Area
Purchase History
| Date | Buyer | Sale Price | Title Company |
|---|---|---|---|
| Patrick And Jancy Ehmann Family Trust | -- | None Listed On Document | |
| Ehmann Patrick Norbert | -- | Allegiance Title Company | |
| Silvey Jack | -- | Metroplex Title Inc | |
| Ragland James D | -- | Metroplex Title Inc |
Source: Public Records
Mortgage History
| Date | Status | Borrower | Loan Amount |
|---|---|---|---|
| Previous Owner | Silvey Jack | $75,318 | |
| Previous Owner | Ragland James D | $40,950 |
Source: Public Records
Tax History
| Year | Tax Paid | Tax Assessment Tax Assessment Total Assessment is a certain percentage of the fair market value that is determined by local assessors to be the total taxable value of land and additions on the property. | Land | Improvement |
|---|---|---|---|---|
| 2025 | $3,502 | $146,202 | $50,000 | $96,202 |
| 2024 | $3,502 | $171,458 | $50,000 | $121,458 |
| 2023 | $3,590 | $179,185 | $30,000 | $149,185 |
| 2022 | $4,075 | $177,000 | $30,000 | $147,000 |
| 2021 | $2,420 | $100,327 | $30,000 | $70,327 |
| 2020 | $2,414 | $100,327 | $30,000 | $70,327 |
| 2019 | $2,456 | $100,327 | $30,000 | $70,327 |
| 2018 | $2,340 | $95,609 | $19,000 | $76,609 |
| 2017 | $2,392 | $94,531 | $19,000 | $75,531 |
| 2016 | $2,392 | $94,531 | $19,000 | $75,531 |
| 2015 | $1,723 | $65,700 | $13,500 | $52,200 |
| 2014 | $1,723 | $65,700 | $13,500 | $52,200 |
Source: Public Records
Map
Nearby Homes
- 231 Elm St
- 701 Harrison Ln
- 528 Buena Vista Dr
- 209 W Cedar St
- 609 Norwood Dr
- 552 Norwood Dr
- 512 Shadowbrook Ln
- 153 Sheri Ln
- 1016 Keith Dr
- 408 Harrison Ln
- 608 W Redbud Dr
- 424 Holder Dr
- 47 Donald Ct
- 712 Pine St
- 521 Val Oaks Ct
- 756 Briarwood Ln
- 758 Briarwood Ln
- 813 Chase Cir
- 416 Simmons Dr
- 624 Forest Ln
Your Personal Tour Guide
Ask me questions while you tour the home.