Estimated Value: $83,000 - $102,048
3
Beds
2
Baths
1,536
Sq Ft
$60/Sq Ft
Est. Value
About This Home
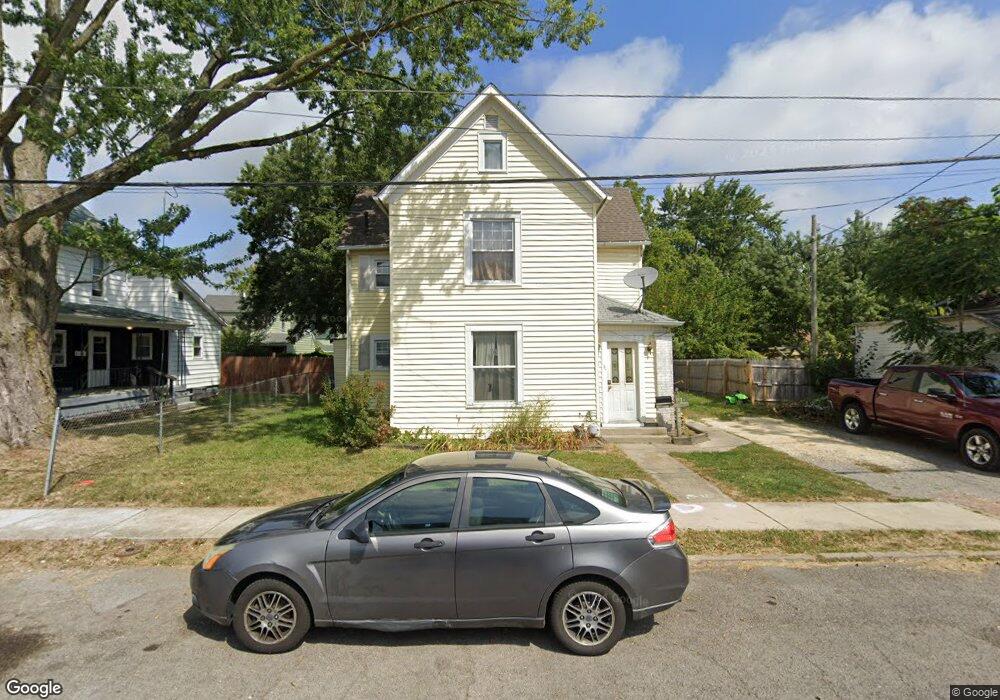
This home is located at 320 Ewing Ave, Lima, OH 45801 and is currently estimated at $92,512, approximately $60 per square foot. 320 Ewing Ave is a home located in Allen County with nearby schools including Independence Elementary School, Lima North Middle School, and Lima West Middle School.
Ownership History
Date
Name
Owned For
Owner Type
Purchase Details
Closed on
Sep 30, 2024
Sold by
Anderson Emmaline R
Bought by
Vanvoorhis Bryan A
Current Estimated Value
Purchase Details
Closed on
Jan 26, 2017
Sold by
Mjk Real Estate Investments Llc
Bought by
Davidson Gary W
Purchase Details
Closed on
May 1, 2002
Sold by
Webb Bradley S
Bought by
Mjk Real Estate Inv Llc
Purchase Details
Closed on
Mar 13, 2001
Sold by
Est Dorothy M Schenk
Bought by
Webb Bradley
Home Financials for this Owner
Home Financials are based on the most recent Mortgage that was taken out on this home.
Original Mortgage
$36,000
Interest Rate
7.75%
Mortgage Type
New Conventional
Purchase Details
Closed on
Dec 8, 1986
Bought by
Schenk Dorothy M
Create a Home Valuation Report for This Property
The Home Valuation Report is an in-depth analysis detailing your home's value as well as a comparison with similar homes in the area
Purchase History
| Date | Buyer | Sale Price | Title Company |
|---|---|---|---|
| Vanvoorhis Bryan A | -- | None Listed On Document | |
| Davidson Gary W | -- | None Available | |
| Mjk Real Estate Inv Llc | $50,000 | -- | |
| Webb Bradley | $36,000 | -- | |
| Schenk Dorothy M | $8,500 | -- |
Source: Public Records
Mortgage History
| Date | Status | Borrower | Loan Amount |
|---|---|---|---|
| Previous Owner | Webb Bradley | $36,000 |
Source: Public Records
Tax History
| Year | Tax Paid | Tax Assessment Tax Assessment Total Assessment is a certain percentage of the fair market value that is determined by local assessors to be the total taxable value of land and additions on the property. | Land | Improvement |
|---|---|---|---|---|
| 2024 | $1,084 | $24,470 | $3,500 | $20,970 |
| 2023 | $931 | $19,290 | $2,770 | $16,520 |
| 2022 | $1,209 | $19,290 | $2,770 | $16,520 |
| 2021 | $902 | $19,290 | $2,770 | $16,520 |
| 2020 | $848 | $16,000 | $2,660 | $13,340 |
| 2019 | $848 | $16,000 | $2,660 | $13,340 |
| 2018 | $844 | $16,000 | $2,660 | $13,340 |
| 2017 | $851 | $16,000 | $2,660 | $13,340 |
| 2016 | $860 | $16,000 | $2,660 | $13,340 |
| 2015 | $880 | $16,000 | $2,660 | $13,340 |
| 2014 | $603 | $10,750 | $2,590 | $8,160 |
| 2013 | $788 | $14,840 | $2,590 | $12,250 |
Source: Public Records
Map
Nearby Homes
- 406 Ewing Ave
- 316 Ewing Ave
- 1021 N McDonel St
- 735 N Elizabeth St
- 934 N Metcalf St
- 557 W Ashton Ave
- 919 N Main St
- 576 W Ashton Ave
- 435 Marian Ave
- 416 Hazel Ave
- 635 W Ashton Ave
- 616-616.5 N Elizabeth St
- 608 W O'Connor Ave
- 645 W O'Connor Ave
- 841 N Baxter St
- 816 N Baxter St
- 555 Haller St
- 638 Hazel Ave
- 631 Hazel Ave
- 5 Unit Package
Your Personal Tour Guide
Ask me questions while you tour the home.