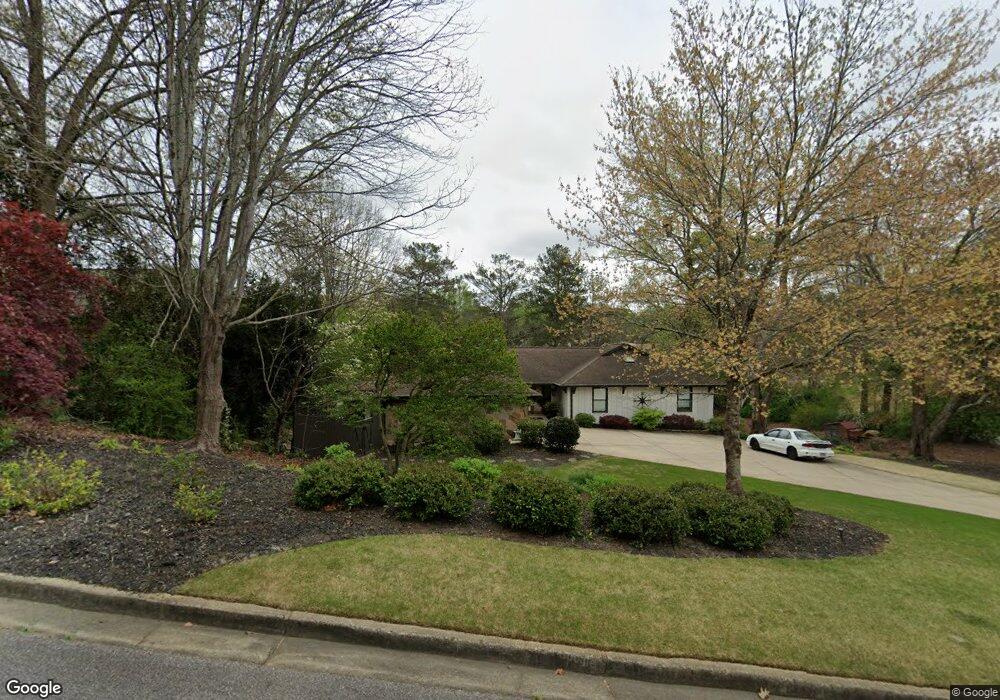
320 Fallen Leaf Ln Unit 5B Roswell, GA 30075
Brookfield West NeighborhoodEstimated Value: $745,309 - $865,000
3
Beds
3
Baths
2,768
Sq Ft
$289/Sq Ft
Est. Value
About This Home
This home is located at 320 Fallen Leaf Ln Unit 5B, Roswell, GA 30075 and is currently estimated at $798,577, approximately $288 per square foot. 320 Fallen Leaf Ln Unit 5B is a home located in Fulton County with nearby schools including Mountain Park Elementary School, Crabapple Middle School, and Roswell High School.
Ownership History
Date
Name
Owned For
Owner Type
Purchase Details
Closed on
Aug 15, 2016
Sold by
Marcella T
Bought by
Robertson Bethany D and Robertson Dean W
Current Estimated Value
Home Financials for this Owner
Home Financials are based on the most recent Mortgage that was taken out on this home.
Original Mortgage
$384,000
Outstanding Balance
$305,792
Interest Rate
3.42%
Mortgage Type
Unknown
Estimated Equity
$492,785
Purchase Details
Closed on
Oct 29, 1999
Sold by
Prescott David N J and Prescott Barbara
Bought by
Bauer Hellmut C and Bauer Marcella T
Home Financials for this Owner
Home Financials are based on the most recent Mortgage that was taken out on this home.
Original Mortgage
$148,800
Interest Rate
7%
Mortgage Type
New Conventional
Create a Home Valuation Report for This Property
The Home Valuation Report is an in-depth analysis detailing your home's value as well as a comparison with similar homes in the area
Home Values in the Area
Average Home Value in this Area
Purchase History
| Date | Buyer | Sale Price | Title Company |
|---|---|---|---|
| Robertson Bethany D | $480,000 | -- | |
| Bauer Hellmut C | $295,000 | -- |
Source: Public Records
Mortgage History
| Date | Status | Borrower | Loan Amount |
|---|---|---|---|
| Open | Robertson Bethany D | $384,000 | |
| Previous Owner | Bauer Hellmut C | $148,800 |
Source: Public Records
Tax History
| Year | Tax Paid | Tax Assessment Tax Assessment Total Assessment is a certain percentage of the fair market value that is determined by local assessors to be the total taxable value of land and additions on the property. | Land | Improvement |
|---|---|---|---|---|
| 2025 | $863 | $259,200 | $59,120 | $200,080 |
| 2023 | $6,254 | $221,560 | $52,520 | $169,040 |
| 2022 | $3,546 | $182,600 | $51,040 | $131,560 |
| 2021 | $4,201 | $156,080 | $44,320 | $111,760 |
| 2020 | $4,265 | $161,560 | $64,720 | $96,840 |
| 2019 | $687 | $163,600 | $55,360 | $108,240 |
| 2018 | $3,911 | $159,760 | $54,040 | $105,720 |
| 2017 | $3,497 | $131,800 | $32,560 | $99,240 |
| 2016 | $3,436 | $131,800 | $32,560 | $99,240 |
| 2015 | $4,158 | $131,800 | $32,560 | $99,240 |
| 2014 | $3,030 | $111,600 | $28,360 | $83,240 |
Source: Public Records
Map
Nearby Homes
- 820 Oakhaven Dr
- 400 Fallen Leaf Ln
- 110 Vistacrest Way
- 12630 Silver Fox Ct
- 0 Cox Rd Unit 7687502
- 0 Cox Rd Unit 10651525
- 0 Cox Rd Unit 7687480
- 0 Cox Rd Unit 10651522
- 215 Winterberry Way
- 110 Cedarwood Ln
- 5045 Rockingham Dr
- 4010 Rockingham Dr
- 175 Cedarwood Ln
- 235 Winterberry Way
- 280 Winterberry Way
- 180 Cedarwood Ln
- 12145 Brookfield Club Dr
- 680 Brookfield Pkwy Unit 1
- 1460 Lakemist Ct
- 12080 Mountain Laurel Dr
- 310 Fallen Leaf Ln
- 340 Fallen Leaf Ln
- 305 Fallen Leaf Ln
- 315 Fallen Leaf Ln
- 300 Fallen Leaf Ln
- 350 Fallen Leaf Ln
- 835 Oakhaven Dr
- 825 Oakhaven Dr
- 855 Oakhaven Dr
- 855 Oakhaven Dr Unit 5B
- 365 Fallen Leaf Ln
- 360 Fallen Leaf Ln
- 815 Oakhaven Dr
- 865 Oakhaven Dr
- 875 Oakhaven Dr
- 370 Fallen Leaf Ln
- 805 Oakhaven Dr Unit 7
- 375 Fallen Leaf Ln
- 840 Oakhaven Dr
Your Personal Tour Guide
Ask me questions while you tour the home.