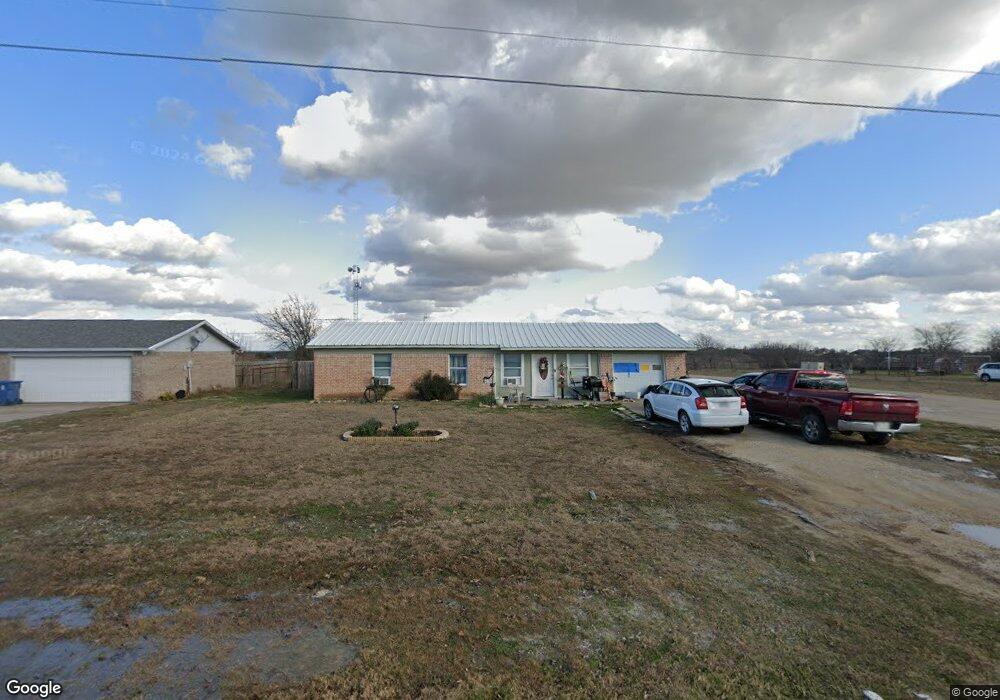
320 Green Acres Rd Weatherford, TX 76088
Estimated Value: $271,000
3
Beds
2
Baths
1,075
Sq Ft
$252/Sq Ft
Est. Value
About This Home
This home is located at 320 Green Acres Rd, Weatherford, TX 76088 and is currently estimated at $271,000, approximately $252 per square foot. 320 Green Acres Rd is a home located in Parker County with nearby schools including Peaster Elementary School, Peaster Middle School, and Peaster High School.
Ownership History
Date
Name
Owned For
Owner Type
Purchase Details
Closed on
Oct 10, 2017
Sold by
Chandler Salfy
Bought by
Moses Emie Lee
Current Estimated Value
Home Financials for this Owner
Home Financials are based on the most recent Mortgage that was taken out on this home.
Original Mortgage
$158,332
Outstanding Balance
$132,110
Interest Rate
3.78%
Mortgage Type
VA
Estimated Equity
$138,890
Purchase Details
Closed on
Jan 5, 2007
Sold by
Dalton J H
Bought by
Chandler Sally
Home Financials for this Owner
Home Financials are based on the most recent Mortgage that was taken out on this home.
Original Mortgage
$67,000
Interest Rate
6.17%
Mortgage Type
Seller Take Back
Purchase Details
Closed on
Oct 11, 2002
Sold by
Hoffman Charles R
Bought by
Chandler Sally
Purchase Details
Closed on
Oct 18, 1989
Bought by
Chandler Sally
Create a Home Valuation Report for This Property
The Home Valuation Report is an in-depth analysis detailing your home's value as well as a comparison with similar homes in the area
Home Values in the Area
Average Home Value in this Area
Purchase History
| Date | Buyer | Sale Price | Title Company |
|---|---|---|---|
| Moses Emie Lee | -- | Providence Title Company | |
| Chandler Sally | -- | -- | |
| Chandler Kenneth | $68,000 | None Available | |
| Chandler Sally | -- | -- | |
| Chandler Sally | -- | -- |
Source: Public Records
Mortgage History
| Date | Status | Borrower | Loan Amount |
|---|---|---|---|
| Open | Moses Emie Lee | $158,332 | |
| Previous Owner | Chandler Kenneth | $67,000 |
Source: Public Records
Tax History Compared to Growth
Tax History
| Year | Tax Paid | Tax Assessment Tax Assessment Total Assessment is a certain percentage of the fair market value that is determined by local assessors to be the total taxable value of land and additions on the property. | Land | Improvement |
|---|---|---|---|---|
| 2025 | $736 | $177,616 | -- | -- |
| 2024 | $736 | $161,469 | -- | -- |
| 2023 | $736 | $146,790 | $0 | $0 |
| 2022 | $2,662 | $152,390 | $23,180 | $129,210 |
| 2021 | $2,439 | $152,390 | $23,180 | $129,210 |
| 2020 | $2,262 | $110,850 | $13,230 | $97,620 |
| 2019 | $2,160 | $110,850 | $13,230 | $97,620 |
| 2018 | $1,970 | $91,150 | $9,900 | $81,250 |
| 2017 | $1,960 | $91,150 | $9,900 | $81,250 |
| 2016 | $1,402 | $65,180 | $9,490 | $55,690 |
| 2015 | $1,383 | $65,180 | $9,490 | $55,690 |
| 2014 | $751 | $35,010 | $9,490 | $25,520 |
Source: Public Records
Map
Nearby Homes
- 319 Green Acres Rd
- 312 Green Acres Rd
- 105 Paige St
- 187 Gibson Ln Unit 171 - 187 Odd Number
- 155 Gibson Ln Unit 155 - 169 Odd Number
- 200 Gibson Ln
- 1205 Johnson Bend Rd
- 143 Gibson Ln
- 231 Dove Hill Ln
- 105 N Ridge Ct
- 3400 Fm 920
- 2501 Zion Hill Rd
- 4200 Fm 920
- 2505 Zion Hill Ln Unit 170 - 184 Even Numbe
- 950 Johnson Bend Rd
- 2001 Woodland Rd
- 1097 Woodland Rd
- 2021 Woodland Rd
- 4320 Fm 920
- 2215 Zion Hill Rd Unit 12
- 322 Green Acres Rd
- 316 Green Acres Rd
- 323 Green Acres Rd
- 0 Green Acres Rd
- 313 Green Acres Rd
- 102 Collett Ct
- 501 Green Acres Rd
- 100 Collett Ct Unit 100-102
- 104 Collett Ct
- 310 Green Acres Rd
- 106 Collett Ct
- 103 Paul St
- 102 Paul St
- 503 Green Acres Rd
- 311 Green Acres Rd
- 108 Collett Ct Unit 110
- 108 Collett Ct
- 00 Jolin Ln
- 104 Paul St
- 309 Green Acres Rd