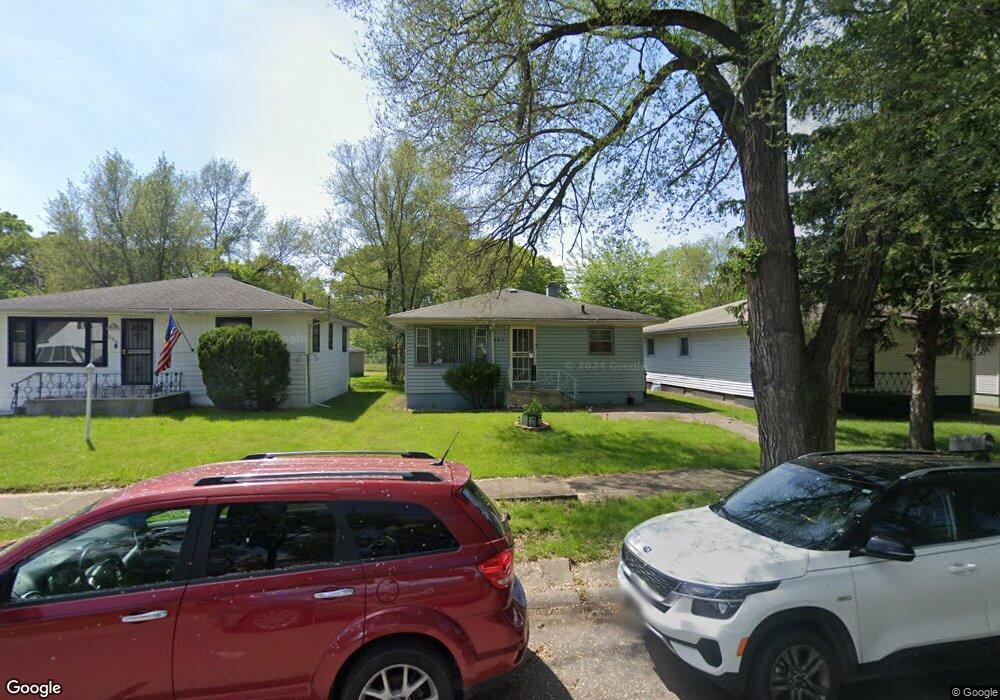
320 Hamlin St Gary, IN 46406
Brunswick NeighborhoodEstimated Value: $97,319 - $133,000
3
Beds
2
Baths
1,015
Sq Ft
$114/Sq Ft
Est. Value
About This Home
This home is located at 320 Hamlin St, Gary, IN 46406 and is currently estimated at $116,080, approximately $114 per square foot. 320 Hamlin St is a home located in Lake County with nearby schools including Bailly Preparatory Academy, West Side Leadership Academy, and Gary Lighthouse Charter School.
Ownership History
Date
Name
Owned For
Owner Type
Purchase Details
Closed on
Apr 12, 2025
Sold by
Kitt Ronald and Kitt Donna D
Bought by
Kitt Michelle Denise
Current Estimated Value
Purchase Details
Closed on
Nov 8, 2024
Sold by
Kitt Ronald and Kitt Donna
Bought by
Kitt Michelle D
Purchase Details
Closed on
Mar 19, 2008
Sold by
Homesales Inc
Bought by
Kitt Ronald and Kitt Donna D
Purchase Details
Closed on
Sep 26, 2007
Sold by
Jpmorgan Chase Bank Na
Bought by
Homesales Inc
Purchase Details
Closed on
Sep 21, 2007
Sold by
Welford James B and Hamilton Latoya M
Bought by
Jpmorgan Chase Bank Na
Create a Home Valuation Report for This Property
The Home Valuation Report is an in-depth analysis detailing your home's value as well as a comparison with similar homes in the area
Home Values in the Area
Average Home Value in this Area
Purchase History
| Date | Buyer | Sale Price | Title Company |
|---|---|---|---|
| Kitt Michelle Denise | -- | None Listed On Document | |
| Kitt Michelle D | -- | None Listed On Document | |
| Kitt Ronald | -- | Heritage Title Services Llc | |
| Homesales Inc | -- | None Available | |
| Jpmorgan Chase Bank Na | $23,651 | None Available |
Source: Public Records
Tax History
| Year | Tax Paid | Tax Assessment Tax Assessment Total Assessment is a certain percentage of the fair market value that is determined by local assessors to be the total taxable value of land and additions on the property. | Land | Improvement |
|---|---|---|---|---|
| 2025 | $1,349 | $61,000 | $7,000 | $54,000 |
| 2024 | $4,505 | $54,000 | $7,000 | $47,000 |
| 2023 | $1,289 | $51,100 | $7,000 | $44,100 |
| 2022 | $1,196 | $46,600 | $4,100 | $42,500 |
| 2021 | $1,111 | $43,300 | $4,100 | $39,200 |
| 2020 | $1,063 | $41,400 | $4,100 | $37,300 |
| 2019 | $905 | $40,500 | $4,100 | $36,400 |
| 2018 | $1,063 | $45,600 | $4,100 | $41,500 |
| 2017 | $1,059 | $46,100 | $4,100 | $42,000 |
| 2016 | $1,083 | $47,900 | $4,100 | $43,800 |
| 2014 | $1,397 | $59,600 | $5,000 | $54,600 |
| 2013 | $618 | $57,700 | $5,000 | $52,700 |
Source: Public Records
Map
Nearby Homes
Your Personal Tour Guide
Ask me questions while you tour the home.