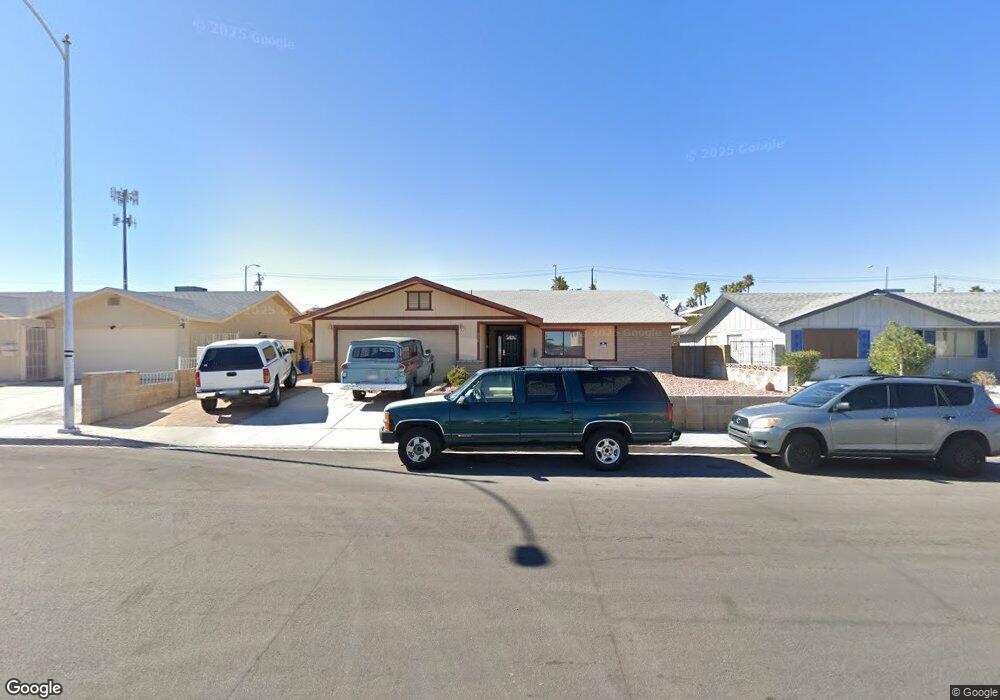
320 Huntly Rd Unit 13C Las Vegas, NV 89145
Charleston Preservation NeighborhoodEstimated Value: $281,000 - $438,000
3
Beds
2
Baths
1,944
Sq Ft
$197/Sq Ft
Est. Value
About This Home
This home is located at 320 Huntly Rd Unit 13C, Las Vegas, NV 89145 and is currently estimated at $382,216, approximately $196 per square foot. 320 Huntly Rd Unit 13C is a home located in Clark County with nearby schools including Helen M Smith Elementary School, Walter Johnson Junior High School Academy of International Studies, and Bonanza High School.
Ownership History
Date
Name
Owned For
Owner Type
Purchase Details
Closed on
Jun 16, 2011
Sold by
Wells Fargo Bank National Association
Bought by
Sanchez Jake
Current Estimated Value
Home Financials for this Owner
Home Financials are based on the most recent Mortgage that was taken out on this home.
Original Mortgage
$38,000
Outstanding Balance
$25,974
Interest Rate
4.45%
Mortgage Type
New Conventional
Estimated Equity
$356,242
Purchase Details
Closed on
Mar 22, 2011
Sold by
Michela Robert
Bought by
Wells Fargo Bank National Association
Purchase Details
Closed on
May 25, 2005
Sold by
Estate Of William Randall Scott
Bought by
Michela Robert
Home Financials for this Owner
Home Financials are based on the most recent Mortgage that was taken out on this home.
Original Mortgage
$187,200
Interest Rate
6.75%
Mortgage Type
Unknown
Purchase Details
Closed on
Dec 4, 1979
Sold by
Scott William Rader and Scott Nancy R
Bought by
Scott William Randall
Create a Home Valuation Report for This Property
The Home Valuation Report is an in-depth analysis detailing your home's value as well as a comparison with similar homes in the area
Home Values in the Area
Average Home Value in this Area
Purchase History
| Date | Buyer | Sale Price | Title Company |
|---|---|---|---|
| Sanchez Jake | $76,000 | Fidelity Rainbow | |
| Wells Fargo Bank National Association | $85,000 | Pasion Title Services | |
| Michela Robert | $234,000 | First Amer Title Co Of Nv | |
| Scott William Randall | -- | -- |
Source: Public Records
Mortgage History
| Date | Status | Borrower | Loan Amount |
|---|---|---|---|
| Open | Sanchez Jake | $38,000 | |
| Previous Owner | Michela Robert | $187,200 | |
| Closed | Michela Robert | $23,400 |
Source: Public Records
Tax History Compared to Growth
Tax History
| Year | Tax Paid | Tax Assessment Tax Assessment Total Assessment is a certain percentage of the fair market value that is determined by local assessors to be the total taxable value of land and additions on the property. | Land | Improvement |
|---|---|---|---|---|
| 2025 | $1,869 | $63,965 | $35,350 | $28,615 |
| 2024 | $1,731 | $63,965 | $35,350 | $28,615 |
| 2023 | $1,152 | $63,285 | $34,650 | $28,635 |
| 2022 | $1,603 | $55,928 | $29,050 | $26,878 |
| 2021 | $1,484 | $52,293 | $26,250 | $26,043 |
| 2020 | $1,376 | $51,271 | $24,850 | $26,421 |
| 2019 | $1,289 | $47,996 | $21,350 | $26,646 |
| 2018 | $1,230 | $44,857 | $18,900 | $25,957 |
| 2017 | $1,438 | $43,869 | $17,150 | $26,719 |
| 2016 | $1,152 | $41,080 | $13,300 | $27,780 |
| 2015 | $1,149 | $38,384 | $10,500 | $27,884 |
| 2014 | $1,113 | $33,200 | $6,300 | $26,900 |
Source: Public Records
Map
Nearby Homes
- 332 Huntly Rd Unit 13C
- 304 S Buffalo Dr Unit 201
- 328 S Buffalo Dr Unit 101
- 338 Jett St Unit 101
- 7601 Ducharme Ave Unit 201
- 212 Bradshaw Way
- 7716 Ducharme Ave
- 7220 Stormson Dr
- 7200 Alta Dr
- 7121 Hurricane Way
- 7213 Lakeland Ct
- 425 Cherry Meadows Ct
- 7212 Raincloud Dr
- 7021 Stormson Dr
- 7012 Pinedale Ave
- 7873 Mount Whitney Cir
- 7830 Foxwood Place Unit 6011
- 7700 Tomich Ave
- 101 Luna Way Unit 267
- 101 Luna Way Unit 145
- 324 Huntly Rd
- 316 Huntly Rd
- 328 Huntly Rd
- 312 Huntly Rd
- 7512 Barkentine St
- 325 Huntly Rd
- 308 Huntly Rd
- 7509 Pinedale Ave
- 7508 Barkentine St
- 329 Huntly Rd Unit 13C
- 7505 Barkentine St
- 400 Huntly Rd
- 304 Huntly Rd
- 333 Huntly Rd
- 7504 Barkentine St
- 7600 Cromberg Ave Unit 201
- 7600 Cromberg Ave Unit 101
- 7600 Cromberg Ave Unit 202
- 7600 Cromberg Ave Unit 102