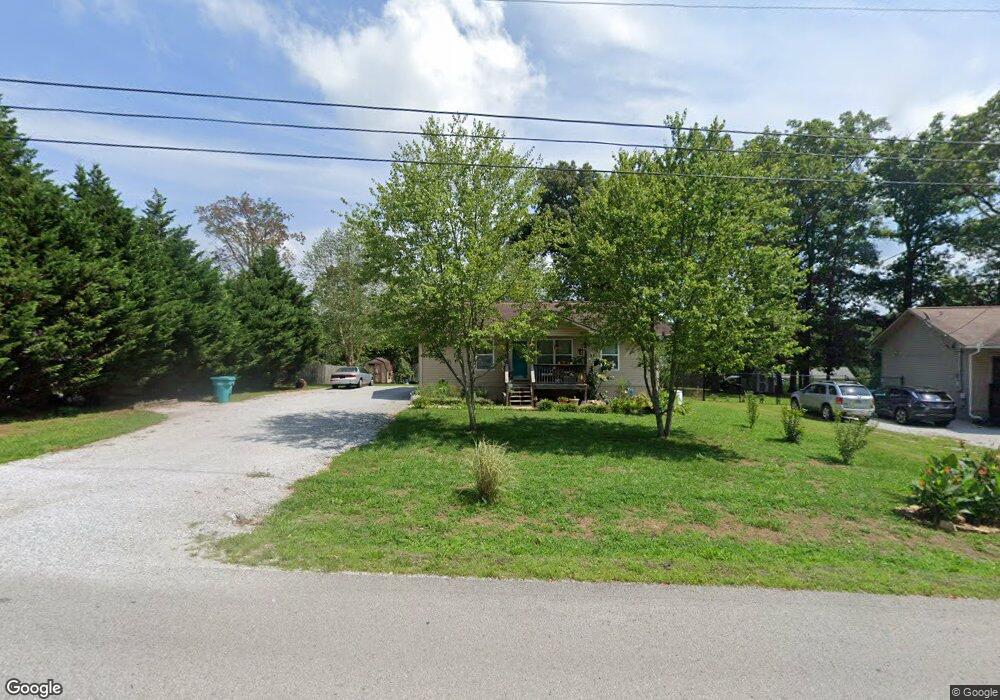
320 Iris Cir Crossville, TN 38555
Estimated Value: $185,465 - $226,000
Studio
--
Bath
1,092
Sq Ft
$193/Sq Ft
Est. Value
About This Home
This home is located at 320 Iris Cir, Crossville, TN 38555 and is currently estimated at $210,616, approximately $192 per square foot. 320 Iris Cir is a home with nearby schools including Glenn Martin Elementary School, Cumberland County High School, and Christian Academy of the Cumberlands.
Ownership History
Date
Name
Owned For
Owner Type
Purchase Details
Closed on
Jan 6, 2011
Sold by
Cumberland County Habitat
Bought by
Davis Isaac
Current Estimated Value
Home Financials for this Owner
Home Financials are based on the most recent Mortgage that was taken out on this home.
Original Mortgage
$75,000
Outstanding Balance
$50,068
Interest Rate
4.58%
Estimated Equity
$160,548
Purchase Details
Closed on
Sep 20, 2007
Bought by
Cumberland Cty Habitat For Humanity
Purchase Details
Closed on
May 22, 1998
Sold by
Smith Clayton
Bought by
Smith Shelley N
Create a Home Valuation Report for This Property
The Home Valuation Report is an in-depth analysis detailing your home's value as well as a comparison with similar homes in the area
Purchase History
| Date | Buyer | Sale Price | Title Company |
|---|---|---|---|
| Davis Isaac | $100,000 | -- | |
| Cumberland Cty Habitat For Humanity | $5,000 | -- | |
| Smith Shelley N | $3,200 | -- |
Source: Public Records
Mortgage History
| Date | Status | Borrower | Loan Amount |
|---|---|---|---|
| Open | Davis Isaac | $75,000 |
Source: Public Records
Tax History
| Year | Tax Paid | Tax Assessment Tax Assessment Total Assessment is a certain percentage of the fair market value that is determined by local assessors to be the total taxable value of land and additions on the property. | Land | Improvement |
|---|---|---|---|---|
| 2025 | -- | $30,050 | $3,125 | $26,925 |
| 2024 | -- | $30,050 | $3,125 | $26,925 |
| 2023 | $341 | $30,050 | $0 | $0 |
| 2022 | $523 | $30,050 | $3,125 | $26,925 |
| 2021 | $502 | $21,675 | $3,125 | $18,550 |
| 2020 | $339 | $21,675 | $3,125 | $18,550 |
| 2019 | $467 | $21,675 | $3,125 | $18,550 |
| 2018 | $467 | $21,675 | $3,125 | $18,550 |
| 2017 | $467 | $21,675 | $3,125 | $18,550 |
| 2016 | $452 | $20,975 | $3,125 | $17,850 |
| 2015 | $446 | $20,975 | $3,125 | $17,850 |
| 2014 | $425 | $20,978 | $0 | $0 |
Source: Public Records
Map
Nearby Homes
- 0 Narcissus St
- 41 Chelsea Dr
- 32 Capitol Dr
- 166 Bob White Dr
- 63 Whitetail Run
- 573 Mockingbird Dr
- 53 Carriage Dr
- 455 Carriage Dr
- 0 Sparta Dr Unit 1328055
- Lot 2 Ivanhoe Ln
- 0 Ivanhoe Ln
- 29 Mockingbird Dr
- 73 Benwick Dr
- 157 Sky View Meadow Dr
- 167 Sky View Meadow Dr
- 175 Sky View Meadow Dr
- 141 Sky View Meadow Dr
- 127 Sky View Meadow Dr
- 158 Sky View Meadow Dr
- 168 Sky View Meadow Dr
Your Personal Tour Guide
Ask me questions while you tour the home.