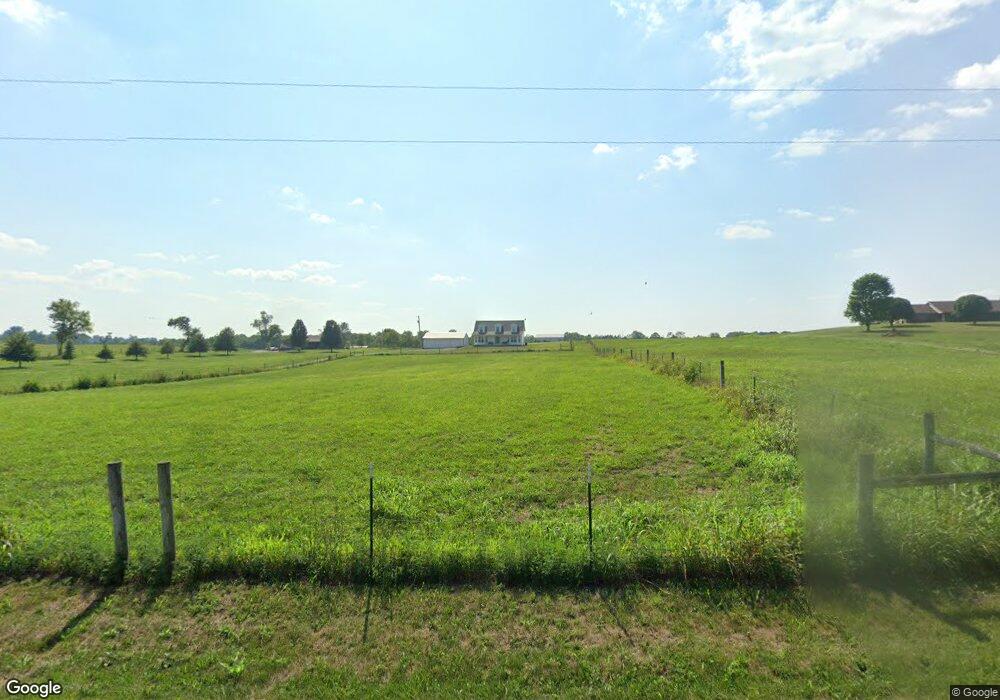
320 Keenon Rd Harrodsburg, KY 40330
Estimated Value: $348,000 - $489,000
3
Beds
3
Baths
2,016
Sq Ft
$197/Sq Ft
Est. Value
About This Home
This home is located at 320 Keenon Rd, Harrodsburg, KY 40330 and is currently estimated at $396,200, approximately $196 per square foot. 320 Keenon Rd is a home located in Mercer County with nearby schools including Mercer County Elementary School, Mercer County Intermediate School, and King Middle School.
Ownership History
Date
Name
Owned For
Owner Type
Purchase Details
Closed on
Aug 2, 2023
Sold by
Giordan Jimmy
Bought by
Giordan Jimmy and Giordan Audriana
Current Estimated Value
Home Financials for this Owner
Home Financials are based on the most recent Mortgage that was taken out on this home.
Original Mortgage
$351,220
Outstanding Balance
$338,050
Interest Rate
4%
Mortgage Type
VA
Estimated Equity
$58,150
Purchase Details
Closed on
May 13, 2015
Sold by
Giordan Jimmy and Giordan Aimee L
Bought by
Giordan Jimmy
Purchase Details
Closed on
Nov 23, 2010
Sold by
Lewis Gary D and Lewis Sheri Elaine
Bought by
Giordan Jimmy and Giordan Aimee L
Home Financials for this Owner
Home Financials are based on the most recent Mortgage that was taken out on this home.
Original Mortgage
$200,000
Interest Rate
4.2%
Create a Home Valuation Report for This Property
The Home Valuation Report is an in-depth analysis detailing your home's value as well as a comparison with similar homes in the area
Home Values in the Area
Average Home Value in this Area
Purchase History
| Date | Buyer | Sale Price | Title Company |
|---|---|---|---|
| Giordan Jimmy | -- | Vylla Title Llc | |
| Giordan Jimmy | -- | Vylla Title Llc | |
| Giordan Jimmy | -- | Attorney | |
| Giordan Jimmy | $200,000 | -- |
Source: Public Records
Mortgage History
| Date | Status | Borrower | Loan Amount |
|---|---|---|---|
| Open | Giordan Jimmy | $351,220 | |
| Closed | Giordan Jimmy | $351,220 | |
| Previous Owner | Giordan Jimmy | $200,000 |
Source: Public Records
Tax History Compared to Growth
Tax History
| Year | Tax Paid | Tax Assessment Tax Assessment Total Assessment is a certain percentage of the fair market value that is determined by local assessors to be the total taxable value of land and additions on the property. | Land | Improvement |
|---|---|---|---|---|
| 2024 | $2,499 | $209,103 | $20,000 | $189,103 |
| 2023 | $2,522 | $209,103 | $0 | $0 |
| 2022 | $2,470 | $209,103 | $0 | $0 |
| 2021 | $2,486 | $209,103 | $0 | $0 |
| 2020 | $2,368 | $200,000 | $20,000 | $180,000 |
| 2019 | $2,404 | $200,000 | $20,000 | $180,000 |
| 2018 | $2,350 | $200,000 | $0 | $0 |
| 2017 | $2,270 | $200,000 | $0 | $0 |
| 2016 | $2,228 | $200,000 | $0 | $0 |
| 2015 | $2,166 | $200,000 | $20,000 | $180,000 |
| 2014 | $2,166 | $200,000 | $0 | $0 |
| 2010 | -- | $214,233 | $25,650 | $188,583 |
Source: Public Records
Map
Nearby Homes
- 1111 Jackson Pike
- 1047 Jackson Pike
- 1256 Jackson Pike
- 935 Keenon Rd
- 127 Man-O-war Dr
- 151 Man-O-war Dr
- 280 Talmage Mayo Rd
- 110 Gracelynn Cir
- 241 Cottonwood St
- 196 Hopewell Rd
- 125 Talmage-Mayo Rd
- 3062 Louisville Rd
- 380 Parsons Ln
- 420 Cole Ln
- 244 Claire de Lune
- 1898 Bohon Rd
- 5980 Bohon Rd
- 143 Providence Rd
- 306 Parsons Ln
- 346 Parsons Ln
- 300 Keenon Rd
- 372 Keenon Rd
- 390 Keenon Rd
- 390 Keenon Rd
- 265 Keenon Rd
- 377 Keenon Rd
- 851 Jackson Pike
- 1 Jackson Pike
- 1370 Jackson Pike Unit G
- 1390 Jackson Pike Unit F
- 914 Jackson Pike
- 685 Jackson Pike
- 510 Keenon Rd
- 1099 Jackson Pike
- 950 Jackson Pike
- 501 Keenon Rd
- 534 Keenon Rd
- 544 Keenon Rd
- 624 Keenon Rd
- 509 Keenon Rd