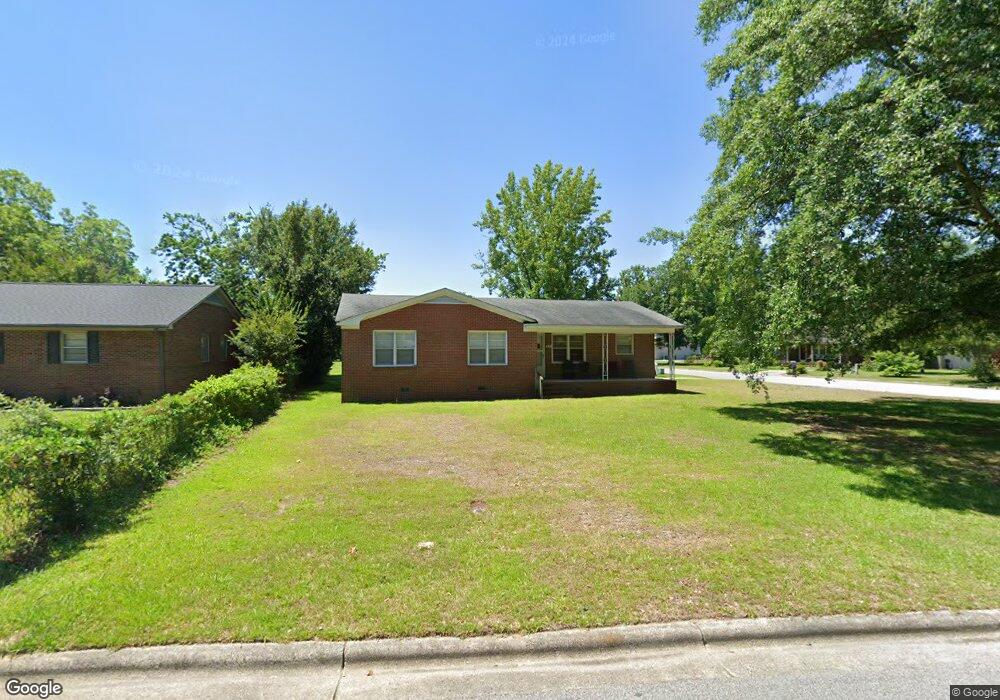
320 Lee St Winterville, NC 28590
Estimated Value: $195,000 - $245,000
3
Beds
2
Baths
1,368
Sq Ft
$154/Sq Ft
Est. Value
About This Home
This home is located at 320 Lee St, Winterville, NC 28590 and is currently estimated at $210,790, approximately $154 per square foot. 320 Lee St is a home located in Pitt County with nearby schools including W.H. Robinson Elementary School, A.G. Cox Middle School, and South Central High School.
Create a Home Valuation Report for This Property
The Home Valuation Report is an in-depth analysis detailing your home's value as well as a comparison with similar homes in the area
Home Values in the Area
Average Home Value in this Area
Tax History Compared to Growth
Tax History
| Year | Tax Paid | Tax Assessment Tax Assessment Total Assessment is a certain percentage of the fair market value that is determined by local assessors to be the total taxable value of land and additions on the property. | Land | Improvement |
|---|---|---|---|---|
| 2025 | $1,273 | $180,445 | $34,000 | $146,445 |
| 2024 | $1,261 | $180,445 | $34,000 | $146,445 |
| 2023 | $748 | $84,898 | $18,000 | $66,898 |
| 2022 | $751 | $84,898 | $18,000 | $66,898 |
| 2021 | $748 | $84,898 | $18,000 | $66,898 |
| 2020 | $752 | $84,898 | $18,000 | $66,898 |
| 2019 | $815 | $95,343 | $18,000 | $77,343 |
| 2018 | $778 | $95,343 | $18,000 | $77,343 |
| 2017 | $778 | $95,343 | $18,000 | $77,343 |
| 2016 | $769 | $95,343 | $18,000 | $77,343 |
| 2015 | $751 | $93,708 | $21,600 | $72,108 |
| 2014 | $751 | $93,708 | $21,600 | $72,108 |
Source: Public Records
Map
Nearby Homes
- 2520 Ange St
- 272 Primrose Ln
- 433 Drexel Ln
- 334 Gayle Blvd
- 2537 Jones St
- 2523 Jones St
- 2531 Jones St
- 227 Hammond St
- 483 Primrose Ln
- 2458 Jones St
- 312 Brogden Ct
- 2414 Glenda St
- 2335 Wedgewood Dr
- 263 Laurie Ellis Rd
- 561 Channel Dr
- 603 Brookfield Dr
- 613 Brookfield Dr
- 2422 Grimes St
- 2841 Verbena Way
- 2920 Jessica Dr Unit A
- 326 Lee St
- 0 Marshall Ave
- 2604 Marshall Ave
- 332 Lee St
- 2623 Marshall Ave
- 2610 Marshall Ave
- 321 Lee St
- 2530 Forbes Ave
- 2626 Marshall Ave
- 2548 Forbes Ave
- 330 Bethana Ct
- 353 Cooper St
- 361 Cooper St
- 2556 Forbes Ave
- 2520 Forbes Ave
- 367 Cooper St
- 2632 Marshall Ave
- 000 Corner of Cooper
- 410 Main St
- 0 Cooper St