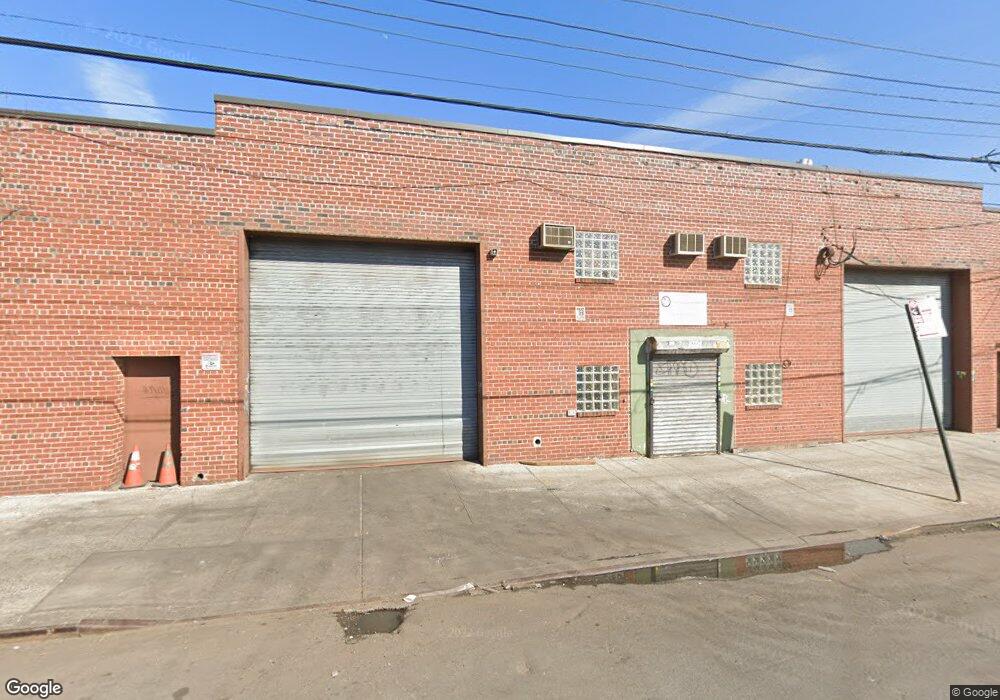
320 Manida St Bronx, NY 10474
Hunts Point NeighborhoodEstimated Value: $1,346,059
Studio
--
Bath
12,500
Sq Ft
$108/Sq Ft
Est. Value
About This Home
This home is located at 320 Manida St, Bronx, NY 10474 and is currently priced at $1,346,059, approximately $107 per square foot. 320 Manida St is a home located in Bronx County with nearby schools including P.S. 48 - Joseph R. Drake, Bronx Academy for Multi-Media, and Leaders In Our Neighborhood Charter School.
Ownership History
Date
Name
Owned For
Owner Type
Purchase Details
Closed on
Feb 26, 1998
Sold by
703 East 134Th Street Llc
Bought by
3 Lefts Inc
Current Estimated Value
Purchase Details
Closed on
Jul 11, 1995
Sold by
Momont Properties Corp
Bought by
703 East 134Th Street Llc
Home Financials for this Owner
Home Financials are based on the most recent Mortgage that was taken out on this home.
Original Mortgage
$200,000
Interest Rate
9%
Mortgage Type
Commercial
Create a Home Valuation Report for This Property
The Home Valuation Report is an in-depth analysis detailing your home's value as well as a comparison with similar homes in the area
Home Values in the Area
Average Home Value in this Area
Purchase History
We collect this data history from publicly available records. To have your information removed, we recommend requesting removal directly through your county’s website.
| Date | Buyer | Sale Price | Title Company |
|---|---|---|---|
| 3 Lefts Inc | $375,000 | -- | |
| 3 Lefts Inc | $375,000 | -- | |
| 703 East 134Th Street Llc | $250,000 | Chicago Title Insurance Co | |
| 703 East 134Th Street Llc | $250,000 | Chicago Title Insurance Co |
Source: Public Records
Mortgage History
We collect this data history from publicly available records. To have your information removed, we recommend requesting removal directly through your county’s website.
| Date | Status | Borrower | Loan Amount |
|---|---|---|---|
| Previous Owner | 703 East 134Th Street Llc | $200,000 |
Source: Public Records
Tax History
| Year | Tax Paid | Tax Assessment Tax Assessment Total Assessment is a certain percentage of the fair market value that is determined by local assessors to be the total taxable value of land and additions on the property. | Land | Improvement |
|---|---|---|---|---|
| 2026 | $118,283 | $694,800 | $225,000 | $469,800 |
| 2025 | $112,783 | $1,099,080 | $225,000 | $874,080 |
| 2024 | $112,783 | $1,064,790 | $225,000 | $839,790 |
| 2023 | $97,568 | $921,150 | $202,590 | $718,560 |
| 2022 | $84,483 | $1,034,550 | $225,000 | $809,550 |
| 2021 | $71,010 | $900,900 | $225,000 | $675,900 |
| 2020 | $59,508 | $1,066,050 | $225,000 | $841,050 |
| 2019 | $44,446 | $472,500 | $112,950 | $359,550 |
| 2018 | $41,815 | $453,600 | $112,950 | $340,650 |
| 2017 | $38,121 | $427,050 | $112,950 | $314,100 |
| 2016 | $34,856 | $404,550 | $112,950 | $291,600 |
| 2015 | $13,061 | $355,950 | $112,950 | $243,000 |
| 2014 | $13,061 | $347,400 | $112,950 | $234,450 |
Source: Public Records
Map
Nearby Homes
- 526 Barretto St
- 163D Edgwater Unit D
- 621 Faile St
- 631 Coster St
- 634 Coster St
- 637 Barretto St
- 645 Barretto St Unit 3G
- 1321 Lafayette Ave
- 831 Longfellow Ave
- 861 Manida St
- 1309 Seneca Ave
- 829 Southern Blvd Unit 3D
- 814 Fox St
- 715 Fox St Unit 4G
- 715 Fox St Unit 5J
- 715 Fox St Unit 4H
- 823 Fox St Unit 4B
- 774 Beck St
- 576 Southern Blvd
- 956 E 156th St
Your Personal Tour Guide
Ask me questions while you tour the home.