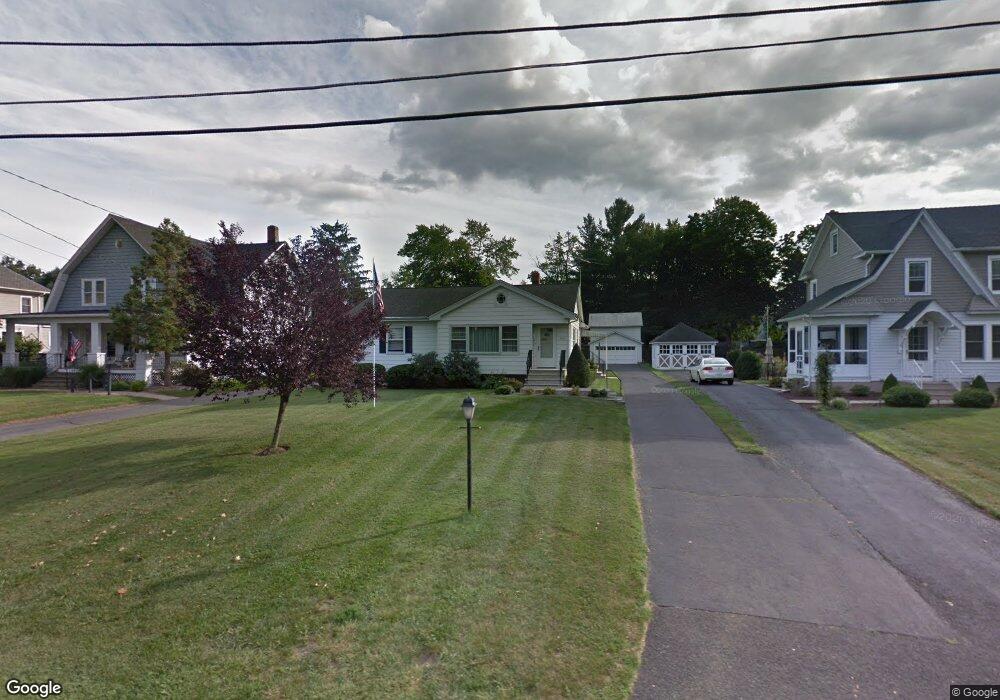
320 Maple Ave Branchburg, NJ 08853
Branchburg Township NeighborhoodEstimated Value: $367,000 - $514,000
--
Bed
--
Bath
1,320
Sq Ft
$344/Sq Ft
Est. Value
About This Home
This home is located at 320 Maple Ave, Branchburg, NJ 08853 and is currently estimated at $454,269, approximately $344 per square foot. 320 Maple Ave is a home located in Somerset County with nearby schools including Whiton Elementary School, Stony Brook School, and Branchburg Central Middle School.
Ownership History
Date
Name
Owned For
Owner Type
Purchase Details
Closed on
Jul 19, 2019
Sold by
Hudak David A
Bought by
Hudak David A and Allshouse Denise
Current Estimated Value
Purchase Details
Closed on
Sep 9, 1993
Sold by
Shurts Martie
Bought by
Maze Waler and Maze Terry
Home Financials for this Owner
Home Financials are based on the most recent Mortgage that was taken out on this home.
Original Mortgage
$108,000
Interest Rate
7%
Create a Home Valuation Report for This Property
The Home Valuation Report is an in-depth analysis detailing your home's value as well as a comparison with similar homes in the area
Home Values in the Area
Average Home Value in this Area
Purchase History
| Date | Buyer | Sale Price | Title Company |
|---|---|---|---|
| Hudak David A | -- | None Available | |
| Maze Waler | $135,000 | -- |
Source: Public Records
Mortgage History
| Date | Status | Borrower | Loan Amount |
|---|---|---|---|
| Closed | Maze Waler | $108,000 |
Source: Public Records
Tax History Compared to Growth
Tax History
| Year | Tax Paid | Tax Assessment Tax Assessment Total Assessment is a certain percentage of the fair market value that is determined by local assessors to be the total taxable value of land and additions on the property. | Land | Improvement |
|---|---|---|---|---|
| 2025 | $6,864 | $410,500 | $127,800 | $282,700 |
| 2024 | $6,864 | $380,500 | $127,800 | $252,700 |
| 2023 | $6,633 | $354,500 | $127,800 | $226,700 |
| 2022 | $6,582 | $334,300 | $127,800 | $206,500 |
| 2021 | $6,748 | $319,200 | $127,800 | $191,400 |
| 2020 | $6,553 | $305,800 | $127,800 | $178,000 |
| 2019 | $6,558 | $304,300 | $127,800 | $176,500 |
| 2018 | $6,520 | $301,700 | $127,800 | $173,900 |
| 2017 | $6,521 | $299,700 | $124,800 | $174,900 |
| 2016 | $6,430 | $293,600 | $124,800 | $168,800 |
| 2015 | $6,383 | $292,000 | $123,800 | $168,200 |
| 2014 | $6,359 | $294,400 | $123,800 | $170,600 |
Source: Public Records
Map
Nearby Homes
- 407 Olive St
- 752 Amwell Rd
- 34 Lehigh Rd
- 718 Mill Ln
- 91 Briar Way
- 838 Riverside Dr
- 64 Murray Dr
- 499 Barton Ln
- 247 Summer Rd
- 581 Montgomery Rd
- 0 Amwell Rd
- 1053 Hillcrest Dr
- 372 Zion Rd
- 373 Zion Rd
- 816 Rt 202
- 200 Milkweed Ct Unit 200
- 126 Carriage Hill Way
- 872 Amwell Rd
- 300 E Mountain Rd
- 205 Hockenbury Rd
- 318 Maple Ave
- 322 Maple Ave
- 316 Maple Ave
- 324 Maple Ave
- 711 Chester Ave
- 709 Chester Ave
- 314 Maple Ave
- 707 Chester Ave
- 317 Maple Ave
- 713 Chester Ave Unit 715
- 321 Maple Ave
- 326 Maple Ave
- 705 Chester Ave
- 313 Maple Ave
- 312 Maple Ave
- 323 Maple Ave
- 717 Chester Ave
- 311 Maple Ave
- 505 Clinton St
- 328 Maple Ave