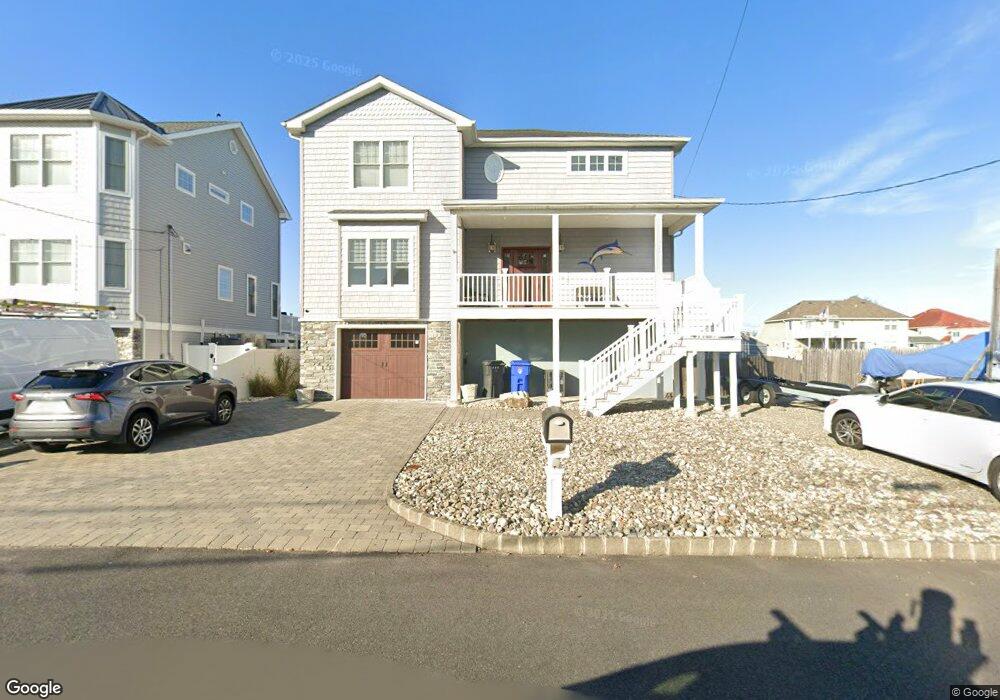
320 Maria Dr Toms River, NJ 08753
Estimated Value: $703,000 - $1,035,726
3
Beds
3
Baths
2,424
Sq Ft
$378/Sq Ft
Est. Value
About This Home
This home is located at 320 Maria Dr, Toms River, NJ 08753 and is currently estimated at $915,182, approximately $377 per square foot. 320 Maria Dr is a home located in Ocean County.
Ownership History
Date
Name
Owned For
Owner Type
Purchase Details
Closed on
Feb 18, 2022
Sold by
Serrenho Octavio A and Serrenho Melisa J
Bought by
Raimo Christopher
Current Estimated Value
Home Financials for this Owner
Home Financials are based on the most recent Mortgage that was taken out on this home.
Original Mortgage
$535,000
Outstanding Balance
$492,980
Interest Rate
3.55%
Mortgage Type
New Conventional
Estimated Equity
$422,202
Purchase Details
Closed on
Jul 31, 2001
Sold by
Publicover Robert
Bought by
Serrenho Octavio and Serrenho Melisa
Home Financials for this Owner
Home Financials are based on the most recent Mortgage that was taken out on this home.
Original Mortgage
$165,000
Interest Rate
7.1%
Create a Home Valuation Report for This Property
The Home Valuation Report is an in-depth analysis detailing your home's value as well as a comparison with similar homes in the area
Home Values in the Area
Average Home Value in this Area
Purchase History
| Date | Buyer | Sale Price | Title Company |
|---|---|---|---|
| Raimo Christopher | $835,000 | None Listed On Document | |
| Serrenho Octavio | $265,000 | -- | |
| Serrenho Octavio | $265,000 | -- |
Source: Public Records
Mortgage History
| Date | Status | Borrower | Loan Amount |
|---|---|---|---|
| Open | Raimo Christopher | $535,000 | |
| Previous Owner | Serrenho Octavio | $165,000 |
Source: Public Records
Tax History
| Year | Tax Paid | Tax Assessment Tax Assessment Total Assessment is a certain percentage of the fair market value that is determined by local assessors to be the total taxable value of land and additions on the property. | Land | Improvement |
|---|---|---|---|---|
| 2025 | $15,134 | $774,100 | $270,000 | $504,100 |
| 2024 | $13,400 | $774,100 | $270,000 | $504,100 |
| 2023 | $12,912 | $774,100 | $270,000 | $504,100 |
| 2022 | $12,912 | $774,100 | $270,000 | $504,100 |
| 2021 | $11,756 | $470,600 | $167,000 | $303,600 |
| 2020 | $11,704 | $470,600 | $167,000 | $303,600 |
| 2019 | $11,196 | $470,600 | $167,000 | $303,600 |
| 2018 | $11,083 | $470,600 | $167,000 | $303,600 |
| 2017 | $11,007 | $470,600 | $167,000 | $303,600 |
| 2016 | $10,328 | $452,200 | $167,000 | $285,200 |
| 2015 | $3,677 | $167,000 | $167,000 | $0 |
| 2014 | $3,495 | $167,000 | $167,000 | $0 |
Source: Public Records
Map
Nearby Homes
Your Personal Tour Guide
Ask me questions while you tour the home.