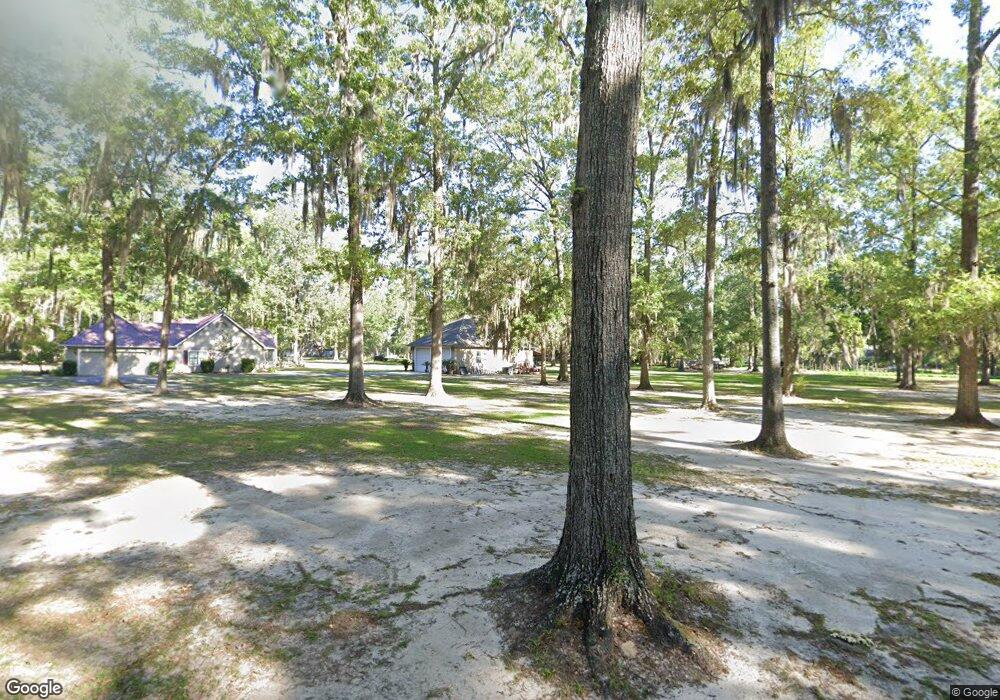
320 Marsh Dr Midway, GA 31320
Estimated Value: $311,000 - $370,677
4
Beds
2
Baths
1,814
Sq Ft
$191/Sq Ft
Est. Value
About This Home
This home is located at 320 Marsh Dr, Midway, GA 31320 and is currently estimated at $345,919, approximately $190 per square foot. 320 Marsh Dr is a home located in Liberty County with nearby schools including Liberty Elementary School, Midway Middle School, and Liberty County High School.
Ownership History
Date
Name
Owned For
Owner Type
Purchase Details
Closed on
Dec 13, 2005
Sold by
Quick David Jack
Bought by
Quick Jack W and Quick Sandra H
Current Estimated Value
Purchase Details
Closed on
Apr 12, 1995
Sold by
Quick Jack W and Quick Sandra H
Bought by
Quick Jack W and Quick Sandra H
Purchase Details
Closed on
Apr 23, 1991
Sold by
Seabrook Island Inc
Bought by
Quick Jack W and Quick Sandra H
Purchase Details
Closed on
Feb 8, 1989
Bought by
Seabrook Island Inc
Create a Home Valuation Report for This Property
The Home Valuation Report is an in-depth analysis detailing your home's value as well as a comparison with similar homes in the area
Purchase History
| Date | Buyer | Sale Price | Title Company |
|---|---|---|---|
| Quick Jack W | -- | -- | |
| Quick Jack W | -- | -- | |
| Quick Jack W | $8,000 | -- | |
| Seabrook Island Inc | -- | -- |
Source: Public Records
Tax History
| Year | Tax Paid | Tax Assessment Tax Assessment Total Assessment is a certain percentage of the fair market value that is determined by local assessors to be the total taxable value of land and additions on the property. | Land | Improvement |
|---|---|---|---|---|
| 2024 | $4,094 | $134,317 | $44,820 | $89,497 |
| 2023 | $3,967 | $123,970 | $44,820 | $79,150 |
| 2022 | $2,235 | $110,225 | $44,820 | $65,405 |
| 2021 | $2,110 | $104,231 | $44,820 | $59,411 |
| 2020 | $2,067 | $92,606 | $34,860 | $57,746 |
| 2019 | $1,955 | $90,883 | $34,860 | $56,023 |
| 2018 | $1,884 | $91,534 | $34,860 | $56,674 |
| 2017 | $2,871 | $87,177 | $24,900 | $62,277 |
| 2016 | $1,659 | $90,405 | $29,880 | $60,525 |
| 2015 | $1,643 | $82,783 | $34,860 | $47,923 |
| 2014 | $1,643 | $87,398 | $39,840 | $47,558 |
| 2013 | -- | $93,845 | $39,840 | $54,005 |
Source: Public Records
Map
Nearby Homes
- 0 Pelican Cove Unit 10688493
- 0 Pelican Cove Unit 166654
- 86 Hidden Dr
- 177 Winoca Dr
- 227 Otto Dr
- 42 Winoca Dr
- 42 Greenwood
- 45 Veranda Trail
- 580 Old Gress Island Rd
- 151 Cottage Loop
- 280 Cottage Loop
- 338 Cottage Loop
- 138-140 Dogwood Ln
- 152-155 Dogwood Ln
- 326 Lake Shore Dr
- 0 Colonial Dr
- 141 Colonial Dr
- 175 Old Sikes Rd
- 15 Tideland Dr
- 0 Oak Ct Unit SA331468
Your Personal Tour Guide
Ask me questions while you tour the home.