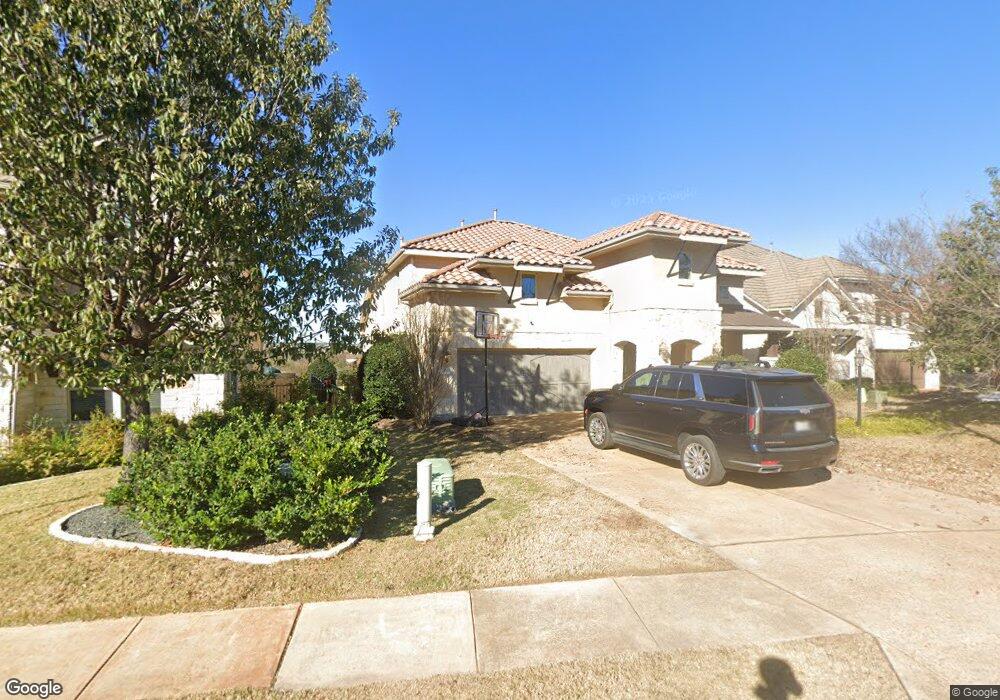
320 Maxwell Way Unit 13 Austin, TX 78738
Estimated Value: $722,000 - $838,000
4
Beds
4
Baths
2,948
Sq Ft
$262/Sq Ft
Est. Value
About This Home
This home is located at 320 Maxwell Way Unit 13, Austin, TX 78738 and is currently estimated at $772,525, approximately $262 per square foot. 320 Maxwell Way Unit 13 is a home located in Travis County with nearby schools including Serene Hills Elementary School, Lake Travis Middle School, and Lake Travis High School.
Ownership History
Date
Name
Owned For
Owner Type
Purchase Details
Closed on
May 10, 2021
Sold by
Kelly Michael P and Kelly Myrna C
Bought by
Nagaraju Mamatha and Thirunagari Murali
Current Estimated Value
Home Financials for this Owner
Home Financials are based on the most recent Mortgage that was taken out on this home.
Original Mortgage
$637,500
Outstanding Balance
$577,734
Interest Rate
3.1%
Mortgage Type
New Conventional
Estimated Equity
$194,791
Purchase Details
Closed on
Dec 14, 2016
Sold by
Heffner Scott E and Heffner Susan M
Bought by
Kelly Michael P and Kelly Myrna C
Purchase Details
Closed on
Sep 10, 2015
Sold by
Lennar Homes Of Texas Sales & Marketing
Bought by
Heffner Scott E and Heffner Susan M
Home Financials for this Owner
Home Financials are based on the most recent Mortgage that was taken out on this home.
Original Mortgage
$386,404
Interest Rate
4.03%
Mortgage Type
New Conventional
Create a Home Valuation Report for This Property
The Home Valuation Report is an in-depth analysis detailing your home's value as well as a comparison with similar homes in the area
Home Values in the Area
Average Home Value in this Area
Purchase History
| Date | Buyer | Sale Price | Title Company |
|---|---|---|---|
| Nagaraju Mamatha | -- | Capital Title Of Texas | |
| Kelly Michael P | -- | None Available | |
| Heffner Scott E | -- | North American Title Company |
Source: Public Records
Mortgage History
| Date | Status | Borrower | Loan Amount |
|---|---|---|---|
| Open | Nagaraju Mamatha | $637,500 | |
| Previous Owner | Heffner Scott E | $386,404 |
Source: Public Records
Tax History
| Year | Tax Paid | Tax Assessment Tax Assessment Total Assessment is a certain percentage of the fair market value that is determined by local assessors to be the total taxable value of land and additions on the property. | Land | Improvement |
|---|---|---|---|---|
| 2025 | $16,918 | $807,092 | $176,094 | $630,998 |
| 2023 | $15,975 | $787,027 | $88,047 | $698,980 |
| 2022 | $18,778 | $850,000 | $88,047 | $761,953 |
| 2021 | $14,196 | $593,410 | $88,047 | $505,363 |
| 2020 | $13,225 | $507,790 | $88,047 | $419,743 |
| 2018 | $13,322 | $481,237 | $88,047 | $393,190 |
| 2017 | $13,321 | $466,483 | $143,076 | $323,407 |
| 2016 | $13,628 | $477,252 | $143,076 | $334,176 |
| 2015 | -- | $253,927 | $143,076 | $110,851 |
Source: Public Records
Map
Nearby Homes
- 176 World of Tennis Square
- 204 Maxwell Way Unit 39
- 204 World of Tennis Square Unit C15
- 106 Maxwell Way Unit 33
- 143 World of Tennis Square Unit D143
- 138 World of Tennis Square
- 109 Bisset Ct
- 133 World of Tennis Square
- 106 Bisset Ct
- 118 World of Tennis Square
- 115 World of Tennis Square
- 114 World of Tennis Square
- 113 World of Tennis Square
- 110 World of Tennis Square Unit D-110
- 107 World of Tennis Square
- 102 World of Tennis Square
- 102 Canyon Turn Trail
- 307 Duffy Ln
- 4312 Lakeway Blvd
- 18 Tourney Ln
- 320 Maxwell Way
- 320 Maxwell Way
- 320 Maxwell Way Unit 13
- 322 Maxwell Way
- 322 Maxwell Way Unit 14
- 322 Maxwell Way
- 316 Maxwell Way Unit 11
- 315 Maxwell Way Unit 16
- 315 Maxwell Way
- 315 Maxwell Way
- 317 Maxwell Way
- 317 Maxwell Way
- 317 Maxwell Way Unit 15
- 314 Maxwell Way
- 313 Maxwell Way
- 313 Maxwell Way
- 123 Schooner Dr
- 121 Schooner Dr
- 314 Maxwell Way Unit 10
- 125 Schooner Dr
Your Personal Tour Guide
Ask me questions while you tour the home.