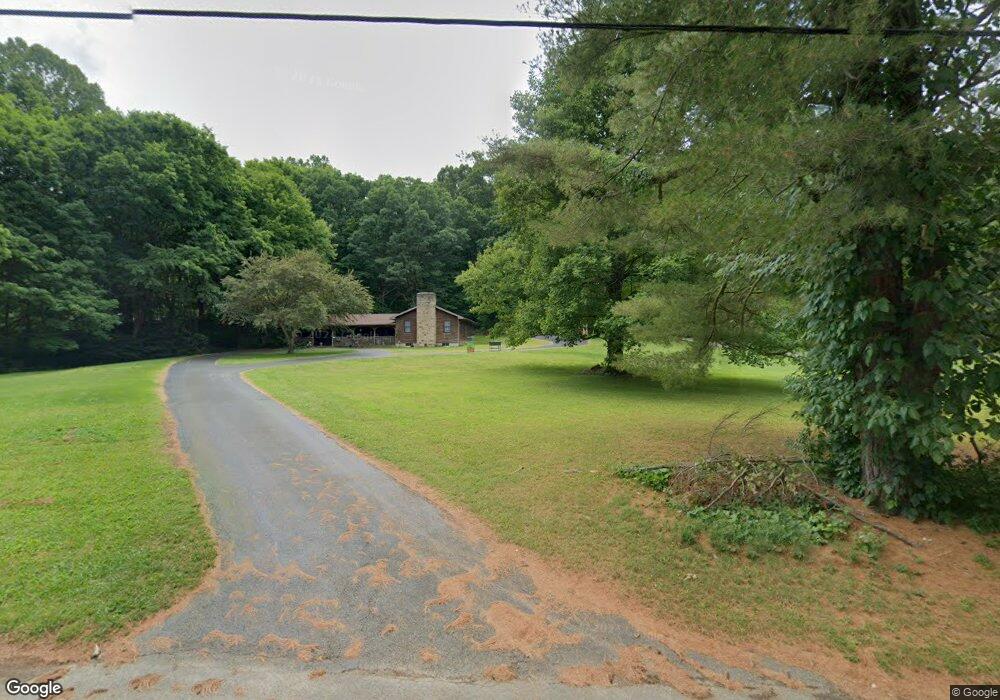
320 Moss Hollow Rd Chillicothe, OH 45601
Estimated Value: $222,000 - $491,203
3
Beds
3
Baths
2,052
Sq Ft
$188/Sq Ft
Est. Value
About This Home
This home is located at 320 Moss Hollow Rd, Chillicothe, OH 45601 and is currently estimated at $385,068, approximately $187 per square foot. 320 Moss Hollow Rd is a home located in Ross County with nearby schools including Chillicothe High School.
Ownership History
Date
Name
Owned For
Owner Type
Purchase Details
Closed on
Mar 26, 2016
Sold by
Bennett Delbert L and Bennett Tami L
Bought by
Morris Eric S
Current Estimated Value
Home Financials for this Owner
Home Financials are based on the most recent Mortgage that was taken out on this home.
Original Mortgage
$325,000
Outstanding Balance
$257,938
Interest Rate
3.65%
Mortgage Type
Closed End Mortgage
Estimated Equity
$127,130
Purchase Details
Closed on
Jul 8, 2009
Sold by
Bennett Delbert L
Bought by
Bennett Ii Delbert L and Bennett Tami L
Home Financials for this Owner
Home Financials are based on the most recent Mortgage that was taken out on this home.
Original Mortgage
$170,000
Interest Rate
5.49%
Mortgage Type
New Conventional
Purchase Details
Closed on
Dec 22, 2004
Sold by
Oliver Patricia A
Bought by
Bennett Ii Delbert L
Create a Home Valuation Report for This Property
The Home Valuation Report is an in-depth analysis detailing your home's value as well as a comparison with similar homes in the area
Home Values in the Area
Average Home Value in this Area
Purchase History
| Date | Buyer | Sale Price | Title Company |
|---|---|---|---|
| Morris Eric S | $345,000 | Attorney | |
| Bennett Ii Delbert L | -- | Attorney | |
| Bennett Ii Delbert L | $6,000 | None Available |
Source: Public Records
Mortgage History
| Date | Status | Borrower | Loan Amount |
|---|---|---|---|
| Open | Morris Eric S | $325,000 | |
| Previous Owner | Bennett Ii Delbert L | $170,000 |
Source: Public Records
Tax History Compared to Growth
Tax History
| Year | Tax Paid | Tax Assessment Tax Assessment Total Assessment is a certain percentage of the fair market value that is determined by local assessors to be the total taxable value of land and additions on the property. | Land | Improvement |
|---|---|---|---|---|
| 2024 | $4,197 | $94,910 | $8,830 | $86,080 |
| 2023 | $4,197 | $105,250 | $19,170 | $86,080 |
| 2022 | $4,618 | $105,250 | $19,170 | $86,080 |
| 2021 | $4,518 | $93,490 | $16,960 | $76,530 |
| 2020 | $4,517 | $93,490 | $16,960 | $76,530 |
| 2019 | $4,486 | $93,490 | $16,960 | $76,530 |
| 2018 | $3,649 | $76,510 | $13,840 | $62,670 |
| 2017 | $3,865 | $76,510 | $13,840 | $62,670 |
| 2016 | $3,748 | $76,510 | $13,840 | $62,670 |
| 2015 | $3,857 | $75,680 | $13,010 | $62,670 |
| 2014 | $3,777 | $75,680 | $13,010 | $62,670 |
| 2013 | $3,781 | $90,080 | $13,010 | $77,070 |
Source: Public Records
Map
Nearby Homes
- 0 Tabernacle Rd
- 92 Oliver Dr
- 0 Massieville Rd
- 2416 Massieville Rd
- 1745 Trego Creek Rd
- 83 James Rd
- 1196 Trego Creek Rd
- 3857 Us Highway 23
- 471 Trego Creek Rd
- 1190 England Hollow Rd
- 5520 Liberty Hill Rd
- 1857 Patton Hill Rd
- 0 Three Locks Rd
- 1 Bradford Dr
- 0 Mcguire Rd Unit 24758011
- 0 Mcguire Rd Unit 1855109
- 0 Mcguire Rd Unit 1819581
- 1799 Woods Hollow Rd
- 1588 Debord Rd
- 1824 Debord Rd
- 258 Moss Hollow Rd
- 286 Moss Hollow Rd
- 324 Moss Hollow Rd
- 307 Moss Hollow Rd
- 269 Moss Hollow Rd
- 337 Moss Hollow Rd
- 337 Moss Hollow Rd
- 370 Moss Hollow Rd
- 313 Oliver Dr
- 345 Moss Hollow Rd
- 289 Oliver Dr
- 357 Moss Hollow Rd
- 384 Moss Hollow Rd
- 391 Moss Hollow Rd
- 414 Moss Hollow Rd
- 249 Oliver Dr
- 401 Moss Hollow Rd
- 456 Moss Hollow Rd
- 431 Moss Hollow Rd
- 368 Moss Hollow Rd