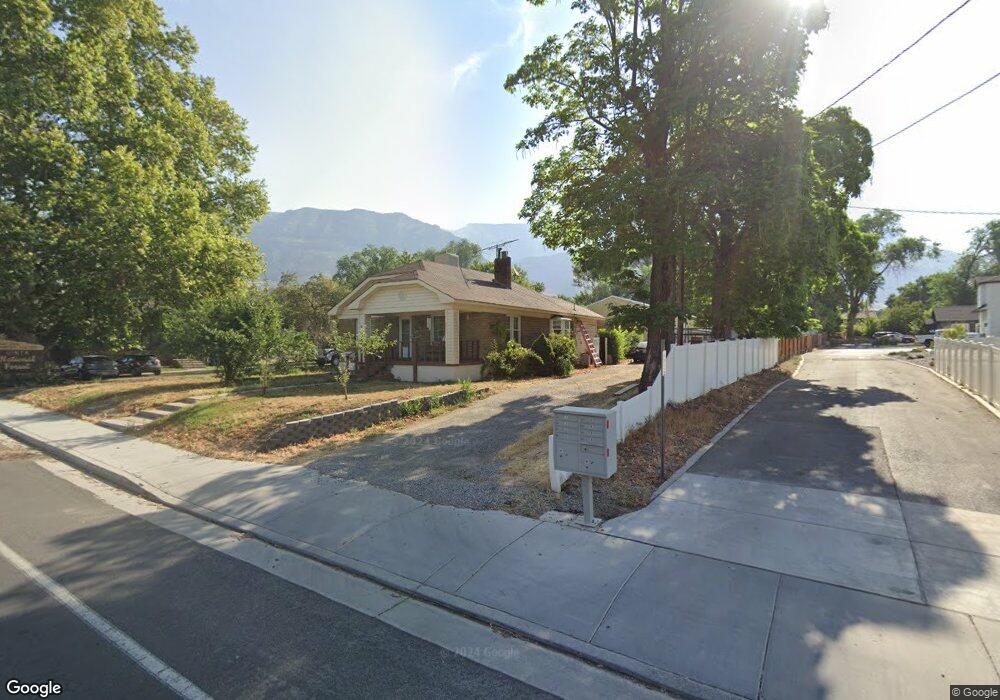
320 N 100 E Pleasant Grove, UT 84062
Estimated Value: $438,000 - $558,000
4
Beds
2
Baths
1,860
Sq Ft
$269/Sq Ft
Est. Value
About This Home
This home is located at 320 N 100 E, Pleasant Grove, UT 84062 and is currently estimated at $499,798, approximately $268 per square foot. 320 N 100 E is a home located in Utah County with nearby schools including Grovecrest Elementary School, Pleasant Grove Junior High School, and Pleasant Grove High School.
Ownership History
Date
Name
Owned For
Owner Type
Purchase Details
Closed on
Aug 19, 2021
Sold by
Still Judith A
Bought by
Still Robert
Current Estimated Value
Home Financials for this Owner
Home Financials are based on the most recent Mortgage that was taken out on this home.
Original Mortgage
$261,000
Outstanding Balance
$236,972
Interest Rate
2.8%
Mortgage Type
New Conventional
Estimated Equity
$262,826
Purchase Details
Closed on
Nov 17, 2014
Sold by
Still Judith A
Bought by
Still Judtih A and Still Robert
Purchase Details
Closed on
Apr 26, 2006
Sold by
Still Judy
Bought by
Still Judith A
Home Financials for this Owner
Home Financials are based on the most recent Mortgage that was taken out on this home.
Original Mortgage
$29,000
Interest Rate
6.29%
Mortgage Type
Credit Line Revolving
Purchase Details
Closed on
Dec 13, 2004
Sold by
Lloyd Randy M and Lloyd Debbie B
Bought by
Still Judy
Purchase Details
Closed on
Mar 30, 2004
Sold by
Lloyd Randy M and Lloyd Debbie B
Bought by
Still Judy
Create a Home Valuation Report for This Property
The Home Valuation Report is an in-depth analysis detailing your home's value as well as a comparison with similar homes in the area
Home Values in the Area
Average Home Value in this Area
Purchase History
| Date | Buyer | Sale Price | Title Company |
|---|---|---|---|
| Still Robert | -- | American Secure Ttl Bringham | |
| Still Judtih A | -- | None Available | |
| Still Judith A | -- | Inwest Title Services Inc | |
| Still Judy | -- | Inwest Title Services Inc | |
| Still Judy | -- | Inwest Title Services Inc |
Source: Public Records
Mortgage History
| Date | Status | Borrower | Loan Amount |
|---|---|---|---|
| Open | Still Robert | $261,000 | |
| Closed | Still Judith A | $29,000 |
Source: Public Records
Tax History
| Year | Tax Paid | Tax Assessment Tax Assessment Total Assessment is a certain percentage of the fair market value that is determined by local assessors to be the total taxable value of land and additions on the property. | Land | Improvement |
|---|---|---|---|---|
| 2025 | $1,904 | $253,165 | -- | -- |
| 2024 | $1,904 | $227,150 | $0 | $0 |
| 2023 | $1,821 | $222,475 | $0 | $0 |
| 2022 | $1,950 | $237,105 | $0 | $0 |
| 2021 | $1,678 | $310,600 | $183,900 | $126,700 |
| 2020 | $1,540 | $279,400 | $164,200 | $115,200 |
| 2019 | $1,338 | $251,100 | $150,900 | $100,200 |
| 2018 | $1,297 | $230,200 | $137,600 | $92,600 |
| 2017 | $1,211 | $114,400 | $0 | $0 |
| 2016 | $1,209 | $110,275 | $0 | $0 |
| 2015 | $1,192 | $102,905 | $0 | $0 |
| 2014 | $1,186 | $101,475 | $0 | $0 |
Source: Public Records
Map
Nearby Homes
Your Personal Tour Guide
Ask me questions while you tour the home.