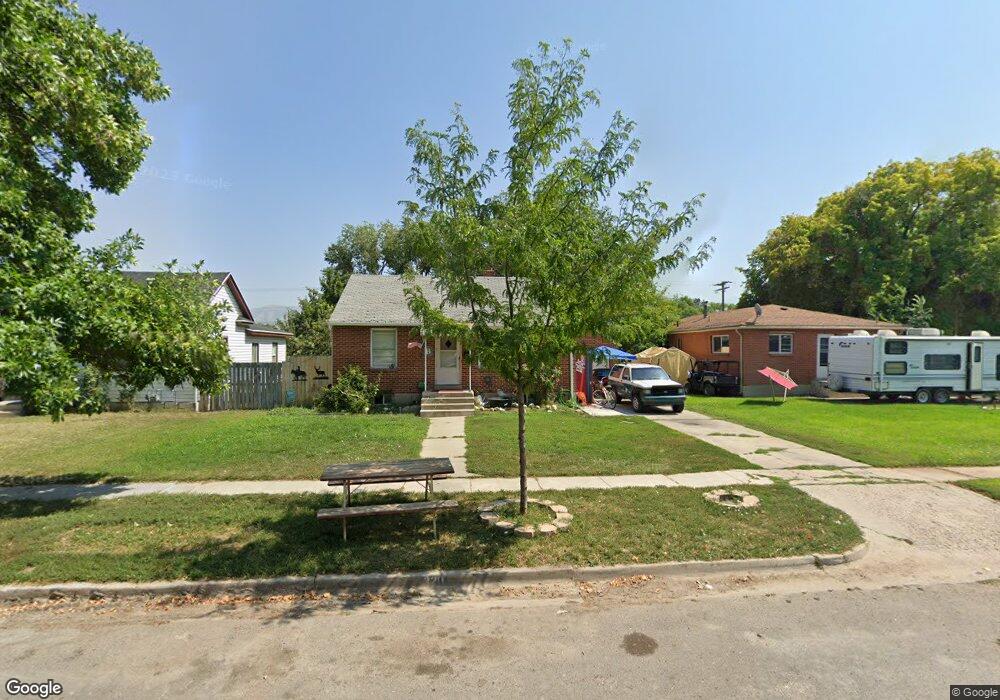
320 N 100 W Tremonton, UT 84337
Estimated Value: $306,000 - $339,995
4
Beds
2
Baths
1,560
Sq Ft
$207/Sq Ft
Est. Value
About This Home
This home is located at 320 N 100 W, Tremonton, UT 84337 and is currently estimated at $323,249, approximately $207 per square foot. 320 N 100 W is a home located in Box Elder County with nearby schools including North Park School, Alice C. Harris Intermediate School, and Bear River Middle School.
Ownership History
Date
Name
Owned For
Owner Type
Purchase Details
Closed on
Oct 27, 2015
Sold by
Garcia Jorge and Garcia Mariana
Bought by
Poulsen Anthony Lee
Current Estimated Value
Home Financials for this Owner
Home Financials are based on the most recent Mortgage that was taken out on this home.
Original Mortgage
$105,912
Outstanding Balance
$83,531
Interest Rate
3.87%
Mortgage Type
New Conventional
Estimated Equity
$239,718
Purchase Details
Closed on
May 3, 2007
Sold by
Furm Investments Llc
Bought by
Garcia Jorge and Garcia Mariana
Home Financials for this Owner
Home Financials are based on the most recent Mortgage that was taken out on this home.
Original Mortgage
$102,500
Interest Rate
6.15%
Mortgage Type
New Conventional
Purchase Details
Closed on
Sep 8, 2006
Sold by
Fuhriman Kathryn Low and Fuhriman Kathryn
Bought by
Frum Investments Llc
Create a Home Valuation Report for This Property
The Home Valuation Report is an in-depth analysis detailing your home's value as well as a comparison with similar homes in the area
Home Values in the Area
Average Home Value in this Area
Purchase History
| Date | Buyer | Sale Price | Title Company |
|---|---|---|---|
| Poulsen Anthony Lee | -- | American Secure Title Tremon | |
| Garcia Jorge | -- | None Available | |
| Frum Investments Llc | -- | None Available |
Source: Public Records
Mortgage History
| Date | Status | Borrower | Loan Amount |
|---|---|---|---|
| Open | Poulsen Anthony Lee | $105,912 | |
| Previous Owner | Garcia Jorge | $102,500 |
Source: Public Records
Tax History Compared to Growth
Tax History
| Year | Tax Paid | Tax Assessment Tax Assessment Total Assessment is a certain percentage of the fair market value that is determined by local assessors to be the total taxable value of land and additions on the property. | Land | Improvement |
|---|---|---|---|---|
| 2025 | $1,760 | $299,556 | $105,000 | $194,556 |
| 2024 | $1,760 | $298,558 | $105,000 | $193,558 |
| 2023 | $1,793 | $298,646 | $100,000 | $198,646 |
| 2022 | $1,568 | $148,933 | $16,500 | $132,433 |
| 2021 | $1,228 | $162,169 | $30,000 | $132,169 |
| 2020 | $1,072 | $162,169 | $30,000 | $132,169 |
| 2019 | $1,001 | $80,830 | $16,500 | $64,330 |
| 2018 | $894 | $67,076 | $13,750 | $53,326 |
| 2017 | $938 | $121,957 | $13,750 | $96,957 |
| 2016 | $924 | $64,537 | $13,750 | $50,787 |
| 2015 | $844 | $59,920 | $13,750 | $46,170 |
| 2014 | $844 | $57,721 | $13,750 | $43,971 |
| 2013 | -- | $57,722 | $13,338 | $44,384 |
Source: Public Records
Map
Nearby Homes