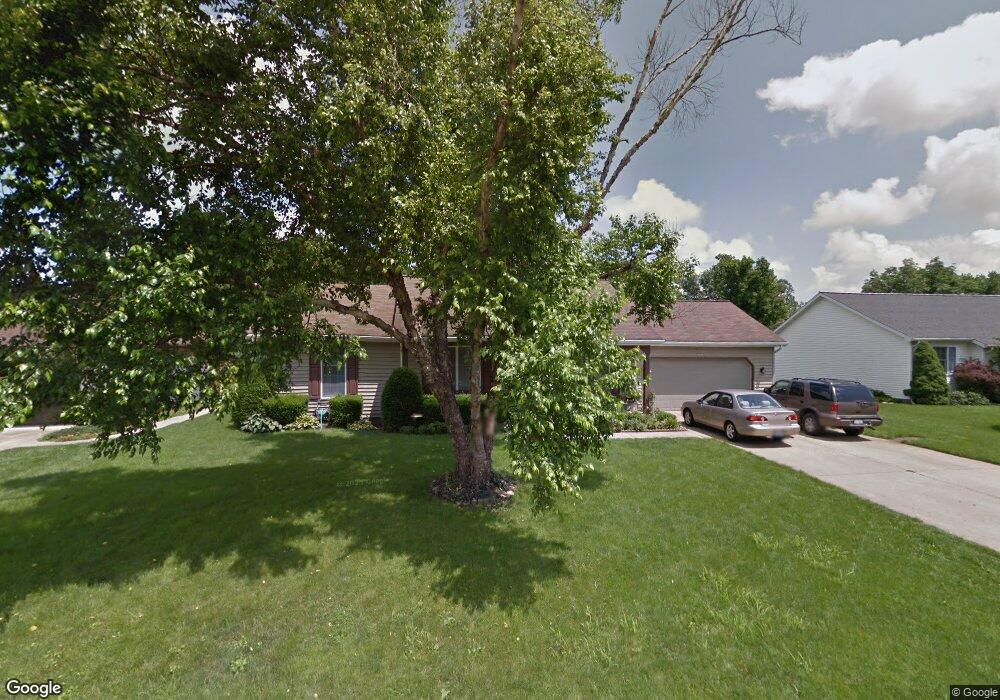
320 N 35th St Mattoon, IL 61938
Estimated Value: $153,000 - $187,061
3
Beds
2
Baths
1,520
Sq Ft
$113/Sq Ft
Est. Value
About This Home
This home is located at 320 N 35th St, Mattoon, IL 61938 and is currently estimated at $172,265, approximately $113 per square foot. 320 N 35th St is a home located in Coles County with nearby schools including Mattoon High School, St Mary School, and St. John's Lutheran School.
Ownership History
Date
Name
Owned For
Owner Type
Purchase Details
Closed on
Jul 6, 2022
Sold by
Jane Powers Monica
Bought by
Powers Monica Jane and Grove Brian Lee
Current Estimated Value
Purchase Details
Closed on
Dec 10, 2008
Sold by
Powers Patrick
Bought by
Powers Monica
Create a Home Valuation Report for This Property
The Home Valuation Report is an in-depth analysis detailing your home's value as well as a comparison with similar homes in the area
Home Values in the Area
Average Home Value in this Area
Purchase History
| Date | Buyer | Sale Price | Title Company |
|---|---|---|---|
| Powers Monica Jane | -- | None Listed On Document | |
| Powers Monica | -- | None Available |
Source: Public Records
Tax History
| Year | Tax Paid | Tax Assessment Tax Assessment Total Assessment is a certain percentage of the fair market value that is determined by local assessors to be the total taxable value of land and additions on the property. | Land | Improvement |
|---|---|---|---|---|
| 2024 | $3,131 | $47,735 | $8,027 | $39,708 |
| 2023 | $2,413 | $42,621 | $7,167 | $35,454 |
| 2022 | $2,413 | $41,917 | $7,049 | $34,868 |
| 2021 | $2,518 | $38,502 | $6,475 | $32,027 |
| 2020 | $2,515 | $39,892 | $6,709 | $33,183 |
| 2019 | $2,566 | $38,502 | $6,475 | $32,027 |
| 2018 | $2,520 | $38,502 | $6,475 | $32,027 |
| 2017 | $2,512 | $38,502 | $6,475 | $32,027 |
| 2016 | $2,459 | $38,502 | $6,475 | $32,027 |
| 2015 | $2,861 | $38,502 | $6,475 | $32,027 |
| 2014 | $2,861 | $38,502 | $6,475 | $32,027 |
| 2013 | $2,861 | $38,502 | $6,475 | $32,027 |
Source: Public Records
Map
Nearby Homes
- 3433 Western Ave
- 3020 Champaign Ave
- 7 Noyes Ct
- 3816 Western Ave
- 2800 Shelby Ave
- 2720 Champaign Ave
- 1104 N 32nd St
- 3905 Western Ave
- 1117 N 32nd St
- 2800 Pine Ave
- 3304 Marion Ave
- 2617 Richmond Ave
- 3512 Walnut Ave
- 109 N 26th St
- 2516 Pine Ave
- 2505 Pine Ave
- 113 S 25th St
- 2502 Pine Ave
- 2413 Moultrie Ave
- 2317 Shelby Ave
Your Personal Tour Guide
Ask me questions while you tour the home.