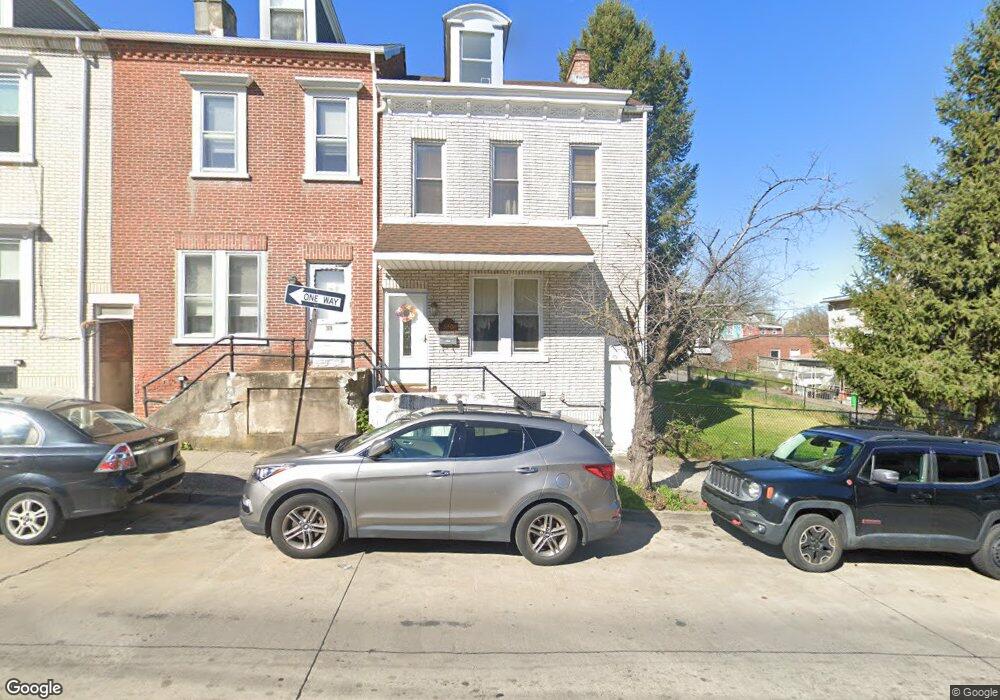
320 N 5th St Allentown, PA 18102
Center City NeighborhoodEstimated Value: $163,000 - $217,000
4
Beds
1
Bath
1,608
Sq Ft
$120/Sq Ft
Est. Value
About This Home
This home is located at 320 N 5th St, Allentown, PA 18102 and is currently estimated at $193,437, approximately $120 per square foot. 320 N 5th St is a home located in Lehigh County with nearby schools including Central Elementary School, Francis D Raub Middle School, and William Allen High School.
Ownership History
Date
Name
Owned For
Owner Type
Purchase Details
Closed on
Oct 31, 2018
Sold by
Gonzales Angel L and Gonzales Maria Cristina Claudio De
Bought by
Koenig Paul C
Current Estimated Value
Home Financials for this Owner
Home Financials are based on the most recent Mortgage that was taken out on this home.
Original Mortgage
$88,000
Outstanding Balance
$76,117
Interest Rate
4.6%
Mortgage Type
VA
Estimated Equity
$117,320
Purchase Details
Closed on
Nov 15, 1996
Sold by
Garcia Lucy
Bought by
Gonzales Angel L
Purchase Details
Closed on
Feb 28, 1978
Bought by
Garcia Lucy
Create a Home Valuation Report for This Property
The Home Valuation Report is an in-depth analysis detailing your home's value as well as a comparison with similar homes in the area
Home Values in the Area
Average Home Value in this Area
Purchase History
| Date | Buyer | Sale Price | Title Company |
|---|---|---|---|
| Koenig Paul C | $88,000 | None Available | |
| Gonzales Angel L | $55,000 | -- | |
| Garcia Lucy | $20,000 | -- |
Source: Public Records
Mortgage History
| Date | Status | Borrower | Loan Amount |
|---|---|---|---|
| Open | Koenig Paul C | $88,000 |
Source: Public Records
Tax History
| Year | Tax Paid | Tax Assessment Tax Assessment Total Assessment is a certain percentage of the fair market value that is determined by local assessors to be the total taxable value of land and additions on the property. | Land | Improvement |
|---|---|---|---|---|
| 2026 | $2,408 | $73,600 | $6,200 | $67,400 |
| 2025 | $2,391 | $73,600 | $6,200 | $67,400 |
| 2024 | $2,391 | $73,600 | $6,200 | $67,400 |
| 2023 | $2,391 | $73,600 | $6,200 | $67,400 |
| 2022 | $2,307 | $73,600 | $67,400 | $6,200 |
| 2021 | $2,261 | $73,600 | $6,200 | $67,400 |
| 2020 | $2,202 | $73,600 | $6,200 | $67,400 |
| 2019 | $2,166 | $73,600 | $6,200 | $67,400 |
| 2018 | $2,014 | $73,400 | $6,000 | $67,400 |
| 2017 | $1,962 | $73,400 | $6,000 | $67,400 |
| 2016 | -- | $73,400 | $6,000 | $67,400 |
| 2015 | -- | $73,400 | $6,000 | $67,400 |
| 2014 | -- | $73,400 | $6,000 | $67,400 |
Source: Public Records
Map
Nearby Homes
Your Personal Tour Guide
Ask me questions while you tour the home.